One of the oldest questions in political philosophy is of course: does size matter? Or to phrase it more precisely for the aims of this blog, does the size of the state influence the level of happiness of its population?
There are two ways of looking at the questions. Firstly, does the size of population matter for the quality of life? And secondly, how large a role should the government play in society?
Small is beautiful
At least at the anecdotal level, the first question is relatively to answer. It appears that smaller countries, typically, have happier populations than larger ones. From a theoretical angle, that makes sense. If a country is smaller, it is more likely to have a more homogenous population, and people are more likely to feel close to each other. For instance, this would result in a better community life, one of the factors associated with happiness. A glance at the 2016 World Happiness Report shows that most of the top-ten countries are relatively small, with Denmark, Switzerland and Iceland in the top-three, and only Canada, Netherlands and Australia (numbers six, seven and nine) having a population above 10 million.
Father state makes you… happy?
There is a second way of looking at the question, though. Does the share that the government takes in the economy and society affect happiness levels? Is it the invasive Big Government or rather the freedom of the laissez faire night-watcher state that makes people best off?
A book by Benjamin Radcliff, The Political Economy of Human Happiness, suggests there are three ways of measuring state size when assessing the correlation: welfare spending; overall government spending; and taxation.
From a theoretic perspective, one could presume a link between government spending and happiness. For instance, welfare policies could be expected to provide the safety net to lower income and/or unemployed people, and therefore reduce inequality. Similarly, a large amount of government spending – for instance by providing free or subsidised education or healthcare – could result in higher happiness levels.
Indeed, the evidence assessed by Radcliff suggests this kind of link. His data shows that for one of the metrics, linked to welfare spending, countries scoring high on this indicator, happiness levels are above one point higher than low-scoring countries. He suggests that this contribution to happiness is double that of being married (being married is positively correlated with happiness), and three times the negative drag of unemployment. To give an example: if your baseline happiness is 7, living in a state with high spending would statistically increase your happiness to 8. Being unemployed would drag it down to 6,7. That’s the magnitude of the influence of the state size according to Radcliff’s evidence!
More tax, more happiness
Government spending doesn’t come for free. While taxation of citizens and companies isn’t the only source of income, it typically is the most significant one. Could it really be the case that being taxed more resulted in citizens being happier?
Again, the data suggest there is a correlation. Radcliff even states that “higher levels of taxation suggest higher levels of satisfaction with life”.
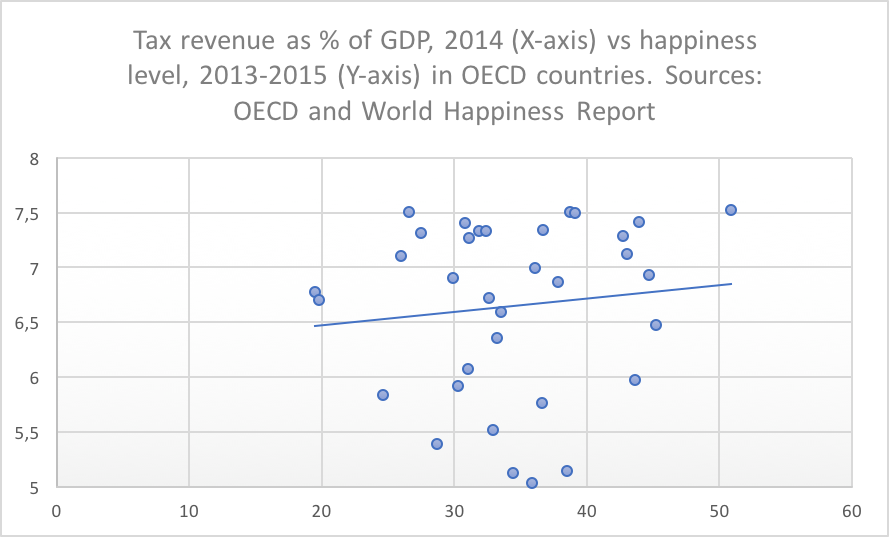
The graph here compares taxation levels (tax revenue as % of GDP) with happiness levels (life satisfaction), based on data from the OECD and the World Happiness Report quoted above. It shows an increasing trendline, associating a level of taxation of 20% in this group of OECD countries with a happiness level of around 6.5. All others thing equal, a level of 50% is correlated with a happiness level of around 6.8: some one thirds of a point higher across the trendline.
But not all others things are equal: the distribution is broad and the effects are very diverse. Denmark is on the top right with a happiness level of 7.526 and the very highest tax level of 50,9. On the far left, we find Switzerland with a marginally lower happiness level of 7.509 and only half the tax rate at 26.6%. On the lowest part of the graph, with happiness levels just above 5 points, we find Portugal, Greece and Hungary, with taxation levels around 34-38%.
Correlation, goes the warning to every first-year student, is not causation. The 34 countries of the OECD provide some interesting figures, but there are many other factors than taxation that determine happiness. Idiosyncratic factors and practical things like a state’s efficiency – what kind of society does is create with the 20 or 50% tax money it collects? – certainly also play a role. I’ll look at some of what the states does next week: the Nanny State.


