Category Archives: Happy Countries

Netherlands: wellbeing is more than wealth, new indicator shows

One of the Dutch traditions in May is ‘Woensdag Gehaktdag’ (a term so nice I won’t translate it). Every year, on the third Wednesday of May, the government justifies how it has implemented the budget in the last year, and the day the opposition fiercely criticises any misallocated cents.

Last week, however, Woensdag Gehaktdag saw an innovation: it saw the presentation of the first annual Monitor Broad Wellbeing. As I wrote before, this new indicator has been instigated by a parliamentary committee requesting a better toolset to evaluate how the Netherlands is doing in a broader sense than only economic indicators. Prepared by the statistics agency in cooperation with the planning agencies (for which my home country has a passion), the Monitor evaluates quality of life in three ways:

  • wellbeing here and now (how are we doing in the Netherlands, today)
  • wellbeing later (how do our choices today affect the future population of the Netherlands)
  • wellbeing elsewhere (how do our choices affect wellbeing elsewhere)

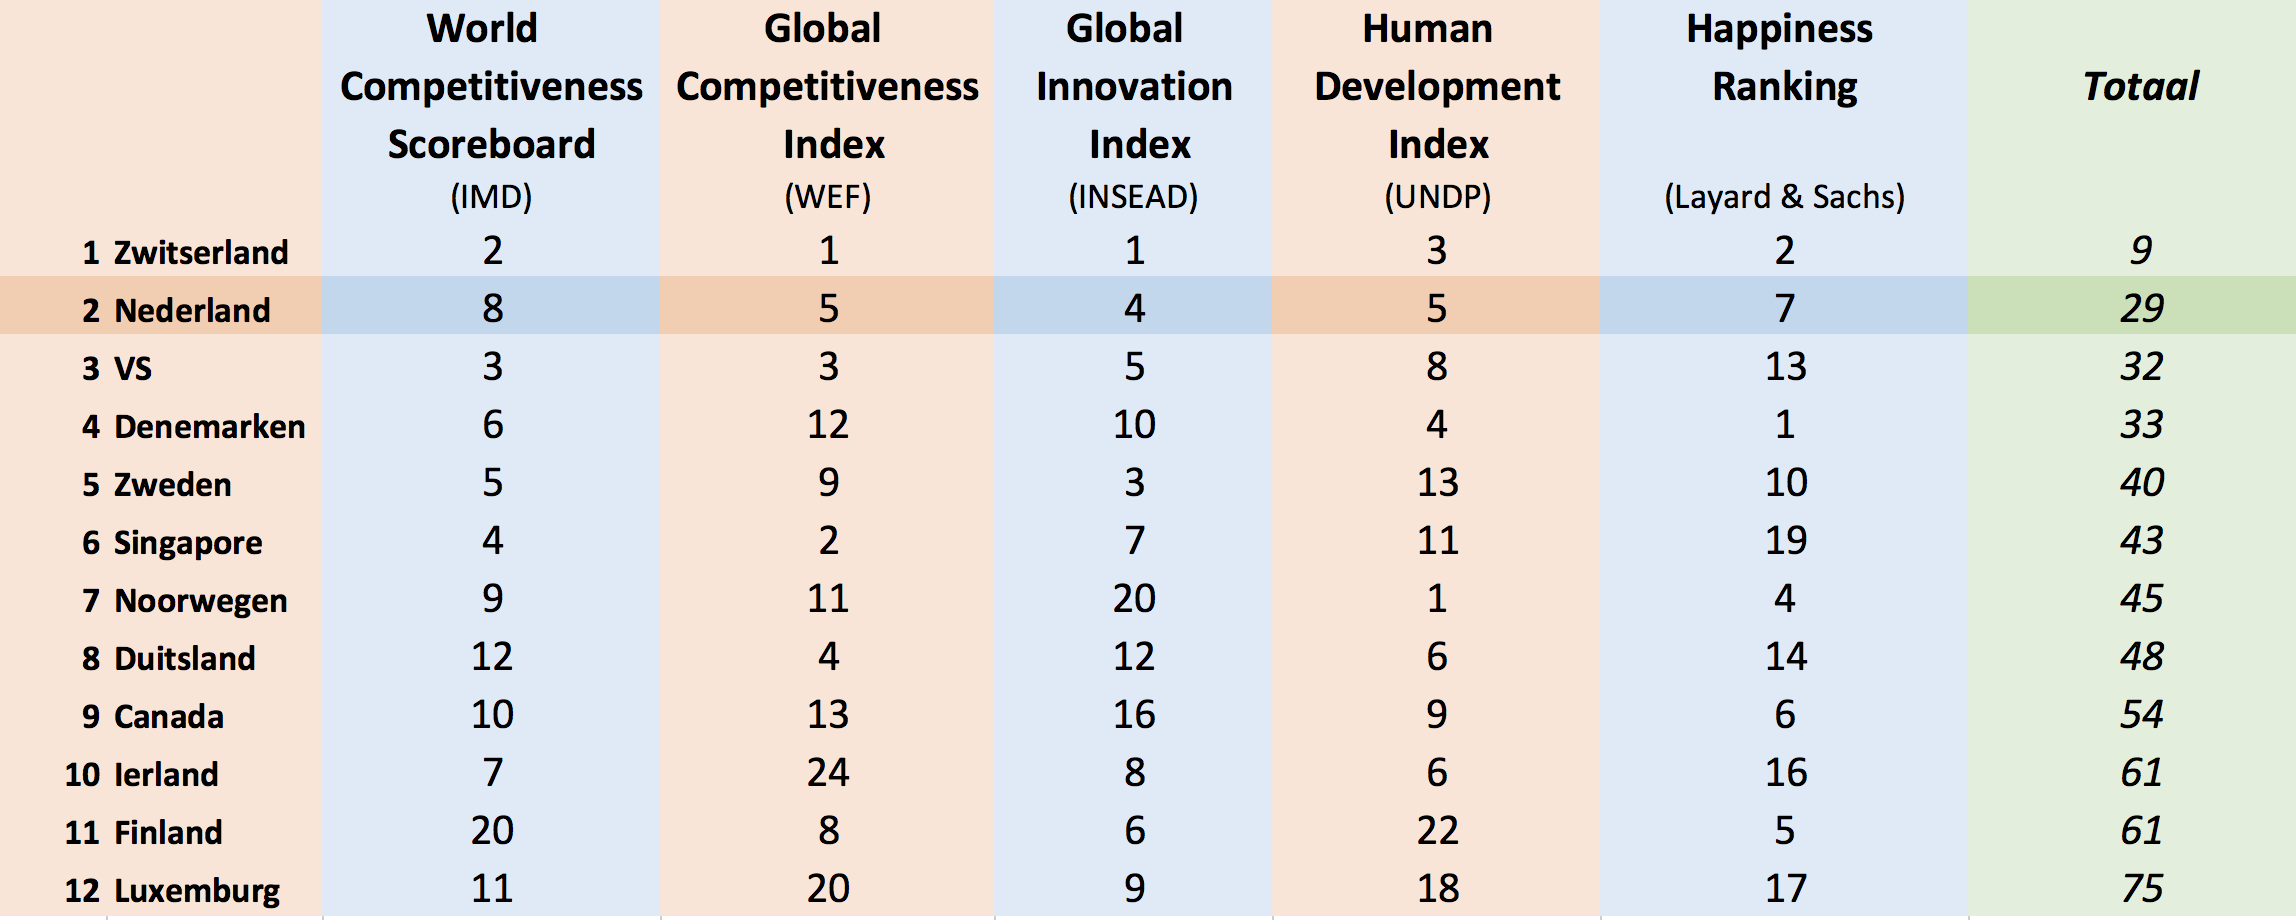
Throw in a mix of economic, social, environmental, trade and a few extra indicators, and you get a detailed picture of what wellbeing looks like. Where data is available, the Dutch performance is also compared with other EU countries.

A high quality of life, but…

So, how is our broad wellbeing? The conclusions of the report are as follows:

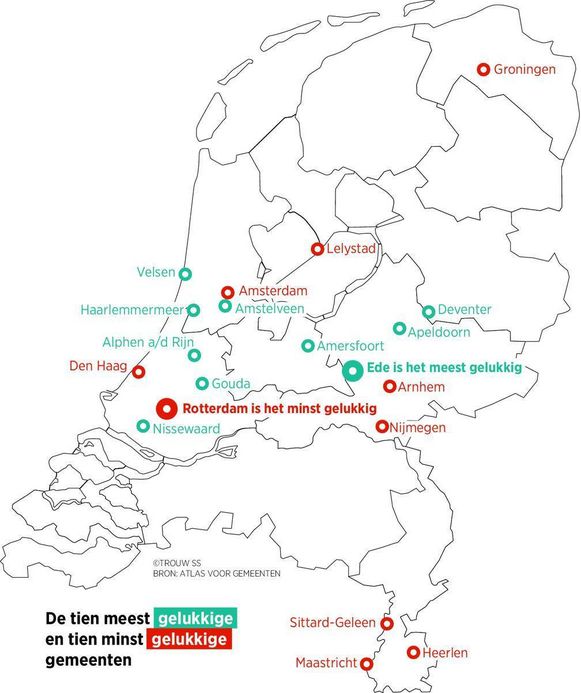
  • Overall, the Netherlands has a high level of quality of life. Many indicators show a positive trend over the last eight years, or a positive change with the year before. Only three out of 21 indicators were markedly negative: the number of people with obesity, satisfaction with free time, and size of nature areas.
  • Nonetheless, the figures aren’t equal. Some groups report lower scores: women, some ago groups (below 25 and 55-65), those with low education levels, and migrants.
  • Here’s the crux: wellbeing scores are clearly higher in the here and now then they are in the future and for the impact on elsewhere. Indicators concerning the future that post lower scores are primarily the environmental ones: CO2 and nitrogen emissions, fossil energy reserves, and biodiversity. Possibly, policy changes may see improvement here in the future, as energy is becoming cleaner and the Netherlands is due to stop all domestic gas production. However, the Netherlands large agro-food business has a massive and unsustainable footprint. You don’t directly see these negative externalities in simple indicators like GDP – a clear example of the value of the Monitor.
  • Another tricky piece is that current wellbeing is also connected with a negative impact in third countries. The Netherlands has a large carbon footprint and imports resources and biomass from elsewhere, including from least developed countries (LDCs). That means that natural capital is moved from those countries.
Broad Wellbeing Monitor, 'Later'. Source: Dutch Statistics Agency

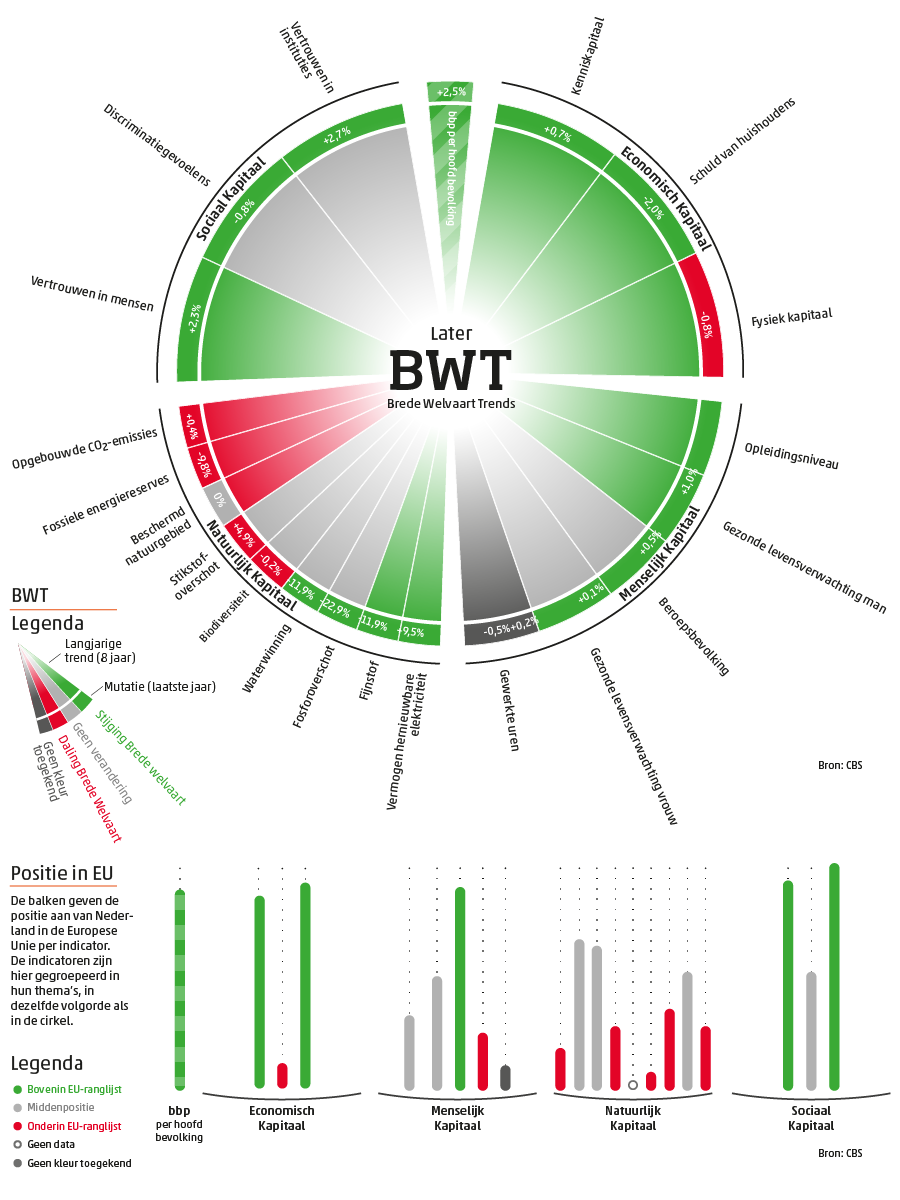
Broad Wellbeing Monitor, ‘Later’. Source: Dutch Statistics Agency. Key: the graph evaluates the impact on wellbeing later across four categories: economic, human, natural, and social capital. Green/red represents positive/negative 8-year trends or 1-year net changes. The lower part of the graph shows how the Netherlands stand compared to fellow EU countries.

Back to politics

The report is a new annual feature, and should become a high-profile publication with an impact on policy formulation. For that, we go back from the statistics agency to politics, to the MPs and the cabinet we have mandated to make choices for us. This Wednesday will see the Parliament evaluate the government’s performance in a plenary debate, and MPs can use findings of the report to encourage the government to reshape their priorities. In this way, they can make the Netherlands a happier place, not only now, but also later and elsewhere.


Ikigai: the happiness of always being busy in Japan

Only staying active will make you want to live a hundred years

The proverb comes from Japan, the origin of the concept of ‘Ikigai‘. Ikigai is now the subject of a new book, and writers Hector Garcia and Francesc Miralles claim the idea has a great promise. They say ikigai – meaning ‘purpose’ or ‘raison d’etre’ – is the Japanese secret to a long and happy life.

Japan is indeed a good place to look for longevity. At 74.9, it has the highest healthy life expectation at birth. A Japanese person that is 60 years old can be expected to still live 21.1 years in good health. And the share of centenarians is far above the global average. In the region of Okinawa, Japan’s southernmost region with a subtropic climate, there are even about 50 in 100,000 people who are older than 100 years.

The happiness of always being busy

Ikigai, say Garcia and Miralles, is what makes people reach one hundred years. Putting it more poetically than purpose, they refer to Ikigai as ‘the happiness of always being busy’.

In Japanese, it is written as 生き甲斐. It can be broken down in 生き, life, and 甲斐, to be worthwhile.

Everybody has an ikigai. If we know what it is, it shapes our days. If we are unsure what our raison d’etre is, we still carry it in ourself. And it’s broader than our passion or desire. Instead, ikigai combines four elements: what you love, what you are good at, what the world needs, and what you can be paid for.

The four dimensions of Ikigai. Source: Toronto Star, diagram by Mark Winn.

The four dimensions of Ikigai. Source: Toronto Star, diagram by Mark Winn.

Long lives in Okinawa

All good so far. Now we know what ikigai is, let’s turn to Garcia and Miralles to find out how Okinawans live to a hundred years and more, and how we can find our personal purpose following their lead.

The authors map a few factors that explain the high age reached by Okinawans:

  • healthy diet, based on a lot of green tea, large amounts of vegetables and fruits, soy products such as tofu, and low sugar consumption. Also, people tend to eat from smaller plates, and until their stomach is 80% full. No all-you-can-eat buffets!
  • closely tied communities. Individuals are part of a moai, or a support group of people with similar interests who look out for each other.
  • a good dose of daily activity of low to moderate intensity: Lots of walking around, and people spend time to tend their gardens.
  • regularly sports activity. Again, these tend to be low to moderate in intensity, like yoga, tai chi or qigong.

Finding your purpose

One of the promises the book makes is that it helps find our purpose. To this end, they share a few stories of what made the life of the eldest residents of Ogimi, Okinawa worth living. A few stories they shared:

The secret to a long life is not to worry. And to keep your heart young – don’t let it grow old. Open your heart to people with a nice smile on your face. If you smile and open your heart, your grandchildren and everyone else will want to see you.

I plant my own vegetables and cook them myself. That’s my ikigai.

Chatting and drinking tea with my neighbours. That’s the best thing in life. And singing together.

Do smiles, vegetables and tea really provide purpose to a life?

While these stories are nice to read, they come from a different origin than ours. Of course we can feel inspired by Japanese 90- or 100-year-olds to do tai chi or qi gong, and to replace our third cup of coffee by a green or white tea (I am trying!), but helping me to find the purpose in my daily life here in Europe is a bigger feat.

Rather than spending a few dozen pages on explaining all tai chi postures, the book could have expanded to offer insights from, say, Japanese philosophy or global psychology on where people find purpose, to inspire the reader to apply these in daily life. Is it really as simple as smiling, growing vegetables, and drinking tea with neighbours. These are sure moments that provide happiness, but does this mundane enjoyment of life really provide purpose? Is it all we need to come to terms with the negative sides of busy lives in the West?

The book also doesn’t dispel another myth. While concrete data on Okinawa itself are hard to come by, as a country, Japan is not too happy. It has indeed the highest Healthy Life Expectancy worth wide, but isn’t scoring as high in the World Happiness Report. In the 2018 edition, it ranks 54th, just below Latvia and just ahead the happiest country of Africa. Asia’s happiest country – Taiwan, is far ahead at spot 26 in the ranking.

Having an ikigai helps, but might be more of an ideal picture than a story representing society at large.

On this International Day of Happiness, learn how Finns pay attention to the right things

Happy International Day of Happiness!

The International Day of Happiness must be my favourite day of the year. It is a recent invention, and only celebrates its fifth anniversary today.

Like every international day, it acts as a reminder to pay attention to the right things. To be aware of what makes us happy, and cut away some of the things that don’t. There are plenty of sources of inspiration that could help make small moments of happiness happen, like on HappyActs or Action for Happiness. Often it’s very simple: say thank you or smile to someone, take a walk in nature, or do a (Random) Act of Kindness.

Source: #HappyActs calendar

Source: #HappyActs calendar, www.happyacts.org


World Happiness Report

The release of the World Happiness Report is now a regular fixture on the calendar. This year, there is a new number one: Finland. It is a sign there is a lot of space at the top: the last few editions also saw Norway, Denmark and Switzerland coming first. (The authors explain that this is due to very small differences in happiness levels among these countries. Next year it could be any of those – or Iceland – again).

All these countries share high performance across the board on factors that strongly correlate with happiness: a well-developed economy, social support, a good health system, personal freedom, trust in public society, and high levels of generosity.

Having said that, there are a couple of things that are particularly interesting in the Finnish case, and that might have helped to build a lead over its competitors for first place.

  • Education in Finland is of high quality. Finnish teachers are highly respected and qualified (a master’s diploma’s are required), and the country scores extremely well in international comparisons.
  • Nature matters. Finland is a scarcely populated country. Having nature makes it easy to get away from daily distractions. It also facilitates an active lifestyle favouring happiness (this is also a factor that it has in common with other high performers, like Norway and Switzerland). Some Finns take this to the extreme though: the practice of winter bathing is popular in some circles. It goes like this: cut a hole in a frozen lake, dip in for a minute or so, and then run for the sauna to warm up.
  • Sisu‘, a concept close to hearts of Finns that helps to keep going. Many Finnish people believe in the idea of ‘sisu’, which means something like grit, resilience or determination. This attitude helps to overcome difficulties, be it a long cold winter or adverse events in life.

Does that mean that everything is perfect in Finland, or any of the other top five countries for that matter. Of course not – paradise on Earth does not exist. But Finland is a state that takes care of education, offers a natural environment that promotes an active life style, and has a cultural strong attachment to grit. These factors all help in the pursuit of happiness. If happiness is about paying attention to the right things, the Finns probably are doing a great job.

Finding happiness in unhappiness: “somehow, it will be” in Poland

Poland, my adopted home since four months, is a country of many associations, albeit often based on cliches. Your associations may be negative: you could think of the troubled history and ongoing struggle to find its place in Europe. They might be positive: a dynamic economy of hard working people valuing family and tradition.

Either way, Poland may not strike you as an extremely happy place. And you are right: Polish hovers somewhere around one-third in the World Happiness Report, ranking 46th out of 155 in the 2017 edition.

The Polish way of happiness

But how happy are Poles really? Is there a Polish way for happiness? These are some of the questions I wanted to research as I moved here.

In my search, I encountered a recent book written on the topic: “Somehow it will be: the Polish way of happiness”, or “Jakoś to będzie. Szczęście po Polsku”. I set out to meet one of the four authors, journalist Beata Chomątowska, to ask what this concept of ‘Jakoś to będzie’ means.

The book, which she co-wrote with Dorota Gruszka, Daniel Lis, and Urszula Pieczek, was born when they noticed a flurry of books on hygge had hit Polish book stores. “Why are Poles reading about hygge? Denmark is doing such a good job in advertising its country. We thought we could also show Poland and Jakoś to będzie as a source of happiness,” Chomątowska said.

The book thus inspires Poles (and foreigners) to take the old-Polish life philosophy to heart, rather than trying to be calm and light candles. The word ‘hyggeligt’ does not come in mind when thinking about Poland.

Jakoś to będzie

As Chomątowska told me,  Jakoś to będzie means something like ‘we will make it’, or ‘somehow it will be’. “It is the most appropriate title. Poles got used to deal with very hard circumstances, to be miserable. Regardless how bad it is, we will manage.”

(After being partitioned between Austria, Prussia and Russia, Poland disappeared from the map in 1795 and only returned in 1919. Twenty years later, World War II and then Communism followed. Poland again became a democracy in 1989).

The book then describes the ‘creative tensions’, or paradoxes, that Chomątowska and her co-authors see in their nation. They are hospitable to their guests, but quarrelsome among themselves. They are ingenuous, but desperate. They are working hard, but also enjoy festivities. All these elements make Poles Poles, and describe their approach to happiness.

Map of Poland filled with traditional folk pattern. Found on dekowizja.pl.

Map of Poland filled with traditional folk pattern. Found on dekowizja.pl.

Without danger, Poland does not thrive

According to Chomątowska, the Polish way of daily life is not made for happiness. She sees Poland as a ‘anti-hygge’ society that cannot live in stability. “Ordinary life is too boring. We can’t deal with it. We need the rush of adrenaline and can’t stand stability for a long time. We always had to fight and be active to reach our goals, like independence”. Without danger, Poland does not thrive.

That doesn’t bode well for happiness. But the picture is changing. Happiness levels tremendously increased in Poland, as the country is one of the biggest economic success stories of the last 25 years. The population enjoys higher salaries and higher wellbeing levels than before. While the country orients itself to Western Europe, Poland is now one of the happiest countries of Central and Eastern Europe, as Poles are often surprised to hear.

And there are more hopeful signs: a public debate on how a life should be well lived is slowly emerging. After the fall of capitalism, capitalism ran wild during the 1990s, but attitudes have been shifting since. “For twenty years, GDP was a fetish. But the younger generation is more aware that there is no sense in working 12 hours a day and run like a hamster in a wheel”.

Finding happiness in unhappiness

Whatever the future holds, Poles have an amazing skill, says Chomątowska:

“Poland is a land of paradoxes. We find happiness in unhappiness. We find it in actions to change our  circumstances because we don’t feel good. We have the ability to create something from nothing”.

And thus, jakoś to będzie. Somehow, it will be.

The Netherlands: small happy cities in a ‘madly cool country’

The population of the Netherlands is two-faced. When we are among ourselves, we like to complain: about our politicians, the weather, taxes, the healthcare system, declines in fixed jobs, and immigration. In this year’s elections, parties with populist policies won over 25% of the vote.

While we tend to be pessimistic about society as a whole, most people are very satisfied with their own lives. Despite our complaints, the Netherlands is one of the happiest countries of the world. Indeed, when we speak to foreigners, we paint a proud picture of our country. We speak of the Netherlands as a country that is hard-working but not too serious, innovative, well-organised, and with high standards of life. PM Rutte’s daily job is to tell Dutchmen they live in a ‘waanzinnig gaaf land’, which means something as a ‘madly cool country’. A Financial Times feature just before the elections broadly supported the claim.

Indeed, if we look at the stats, it is fair to say ‘The Netherlands second’, as the viral video presenting the country to President Trump did this year did. Dutch economist Mathijs Bouman mapped the Netherlands’ performance on a range of indicators, comparing various rankings on competitiveness, innovation and human development. His conclusion? The Netherlands is the best country of the world, second only to… Switzerland. Only when the World Happiness Report was added, the Netherlands jumped over the United States to second place.

The Netherlands second. Source: Mathijs Bouman, http://mathijsbouman.nl/nederland-is-het-beste-land-ter-wereld-op-zwitserland-na/

The Netherlands second. Source: Mathijs Bouman, http://mathijsbouman.nl/nederland-is-het-beste-land-ter-wereld-op-zwitserland-na/

Happiness: the last frontier

With good scores on so many levels, it is time to reach the last frontier: make society even happier. And the Dutch are getting to business: over the last years, society’s happiness and alternative indicators have gained more attention in the Dutch public debate. Last year, the Dutch Parliament supported steps to create a ‘Monitor Broad Well-being’, to better assess quality of life in the Netherlands.

A happiness atlas

Researchers and marketeers are also spending time on the topic. Recently, a study crowned the central Netherlands town of Ede the happiest city of the Netherlands.

The Atlas of Municipalities, prepared with the support of the Happiness Research Centre of the University of Rotterdam, compared happiness levels in the 50 largest towns. Mid-sized towns like Ede, Apeldoorn and Gouda rank to the top, while most of the larger cities like Groningen, Amsterdam and The Hague are on the bottom of the table. Rotterdam, the second-largest city, even closes the list of 50. The map below outlines the top-10 in turquoise, and the bottom 1o in red.

This map shows cities ranked 1-10 (in turquoise) and 41-50 (in red) in the Atlas of Municipalities. Source: Trouw, based on data of the Atlas. https://www.trouw.nl/home/het-geluk-is-te-vinden-in-een-middelgrote-stad-ede~aeb4553a/

This map shows cities ranked 1-10 (in turquoise) and 41-50 (in red) in the Atlas of Municipalities. Source: Trouw, based on data of the Atlas.
https://www.trouw.nl/home/het-geluk-is-te-vinden-in-een-middelgrote-stad-ede~aeb4553a/

What is happiness, anyway?

Let’s dig in a little bit deeper into what this all means. First of all, what is happiness anyway? For the purposes of the study, it is “the extent to which an individual find satisfaction in their own life as a whole”. ‘Happiness’ is then measured via three metrics: an overall judgement of a respondent’s life satisfaction as a whole, the extent to which one is a happy human being, and the extent to which one felt happy in the last four weeks. Ede overall scored best at this, with 89% of the local population scoring at least an average of 7 out of 10 among the three.

Second, how is Ede different than others? The researchers identified seven factors that account for the differences in happiness levels across Ede and the other cities. These, include the size and composition of the population, the employment rate, health, religion, and the attractiveness of life in the city. That however doesn’t mean that Ede is the only city doing well on those factors, or on happiness. Overall, smaller cities tend to perform better than bigger ones: here, life is less chaotic, while there is more on offer than on the countryside.

Marginal differences

The differences between cities appear quite marginal and probably are not statistically significant. 17 out of the 50-sample score 88 or 89%, no fewer than 42 are in the 85-89% bucket, and even number last Rotterdam houses 82% of happy people. As such, the meaning of being ranked first, second, or even thirtieth, is fairly limited.

Other indices in the Atlas convey this point even more. The happiness index is only an annual theme of the Atlas, which annually compares cities on a range of metrics. Some of these metrics are pooled into indices, for instance mapping ‘attractiveness’ and social-economic performance.

The ‘attractiveness’ index aims to compare how attractive cities are as a place to live for the Dutch population. It looks at factors such as the jobs within range of the city, the share of owned and pre-war homes, distance to nature, and the culinary and cultural offer. The social-economic index, as the name says, looks at elements like employment, the population share on welfare and with low education levels, and the poverty rate.

Both rankings offer a radically different overview than the happiness ranking: ‘Happy’ Ede finds itself back at the 15th place as for its social-economic performance. ‘Unhappy’ Rotterdam is found a more attractive place to live than Ede (respectively 17th and 22nd on the attractiveness index).

Spotting strengths and weaknesses

The takeaway? Indices help to spot cities’ strengths and weaknesses, especially when you dig in the underlying data via the OECD-type dashboard approach the Atlas offers. But different measurements give different results. While it is fun to publish such rankings and see how our cities perform, one cannot a lot of value to small differences or annual movements in the Netherlands. And the key message remains that life in the Netherlands is good. We can be among 82% of happy fellow citizens, or among 89% in Ede. In this sense, the Dutch do live in a ‘madly cool country’, as Prime Minister Rutte said.

Celebrating the International Day of Happiness

One of the comments Twitter had a lot yesterday: ‘who decided that the International Day of Happiness would be on Monday’?

While Monday isn’t the least happy day of the week (it’s Wednesday), it may be a surprise that the first day of the new working week is the International Day of Happiness. But that was just the case this year: the day simply falls on 20 March, every year, forever.

It seems that interest in the day has picked up compared to when I wrote about it in 2014 and 2015. Via Twitter, I was flooded with articles and infographics about ways to be happy and happiness at work. That’s a great development, I’d say!

The World Happiness Report 2017

The publication of the World Happiness Report has become another regular fixture on the calendar of happiness enthusiasts (see my take in 2015 here). This year, its release coincided with the International Day of Happiness.

Looking at the results, there were a couple of surprises:

  • Norway narrowly overtook Denmark (1st in 2016 and also in 2014) as the happiest country in the data from 2014-2016. A very important disclaimer: the differences between these two and Iceland (3rd) Switzerland (4th, ranked 1st in 2015) are statistically insignificant. In brief, we don’t really know if Norwegians are really happier than the Swiss.
  • It remains mind-blowing how important equal societies, high trust (measured via perceptions of corruptions), and small populations are. Like last year, the rest of the top-10 is completed by Finland, Netherlands, Canada, New Zealand, Australia and Sweden.
  • The section on the United States recognises its decline. This is not a failure in attempts to Make America Great Again – though polarisation is probably part of the problem. Declining social support and a reduced trust are the factors associated with this. Jeffrey Sachs observes that the US ranked 3rd in the OECD in 2007, compared to 19th in 2016. Given the fact that GDP is still growing but happiness is in decline, it is imperative that the US works on its social crisis.
  • Also in China, the data show surprising results. China’s GDP per capita has seen a five-fold increase in 25 years. If money were to buy happiness, the levels of happiness and well-being should increase, especially for the millions of people who escaped poverty and came to form China’s new middle class. Instead, multiple studies reveal that happiness fell a bit in the 2000-2005 period, before increasing again in 2010-2014. In the earlier period, unemployment and a weaker social safety net reduced happiness, and the recovery of happiness levels took a long time. China now ranks 79th, below South Korea and the Philippines, but ahead of Indonesia and Vietnam. It also outranks Greece, where happiness suffered during the long-standing economic crisis, and the cradle of Gross National Happiness (GNH), Bhutan.


Mapping happiness

With the exception of pockets of red (unhappy) and orange (less happy) in Africa and part of the Middle East and Asia, overall, the world looks quite green and happy. There is a lot green to see on this map, from North America to Latin America, in Europe, in most of Asia, and in Oceania. Overall, the world is quite a happy place – and mind you, it’s the only planet where the International Day of Happiness is celebrated!


Schermafbeelding 2017-03-21 om 09.30.02

The Social Progress Index: is your region better than its peers?

One of the common themes in my explorations on this blog has been in ‘alternative indicators’, or tools that are better equipped to measure quality of life than Gross Domestic Product (GDP). One of the most prominent ‘beyond GDP’ tools is the Social Progress Index, which I labelled “a better way to measure a good society”. And the SPI has seen a lot of development since my post of last year.

Let me start with a recap: the Social Progress Index (SPI) is developed as a broader notion of progress than GDP. It consists of 53 indicators, under the headings ‘basic human needs’ (shelter, access to clean water), ‘foundations of well-being (health, internet access) and ‘opportunity’ (human rights, social tolerance). Typically, countries tend to score higher on  basic human needs, as these often are met in high and middle income countries, even if they don’t meet the same standards on the social issues. Roughly speaking, performance for opportunity is lower, even in the richest countries. The exercise has been conducted for a couple of years now. In the 2016 update released this June, the list is topped by Finland, Canada and Denmark.

Better than your peers?

The aim of the index is similar to other beyond GDP tools I discussed like the OECD’s Better Live Index. Namely, to identify the areas of ‘progress’ or well-being in which a country is doing well, and those where it is underperforming peers. The concept of peer group is an important facet: the strengths and weaknesses are listed in comparison to a 15-country group of peers with similar levels of GDP.

This type of screening tool, in theory, could be used to help countries identify in which policy areas they could invest. The thought is that by learning from over-performing peers’ best practices, countries can use their limited resources in the most efficient way, namely by generating the highest additional well-being. The SPI has expanded a lot in the last year, starting projects with the US State of Minnesota, Reykjavik, Iceland, in the capital Bogota, other cities in Colombia and elsewhere in Latin America.

This is how the world is doing in social progress in 2016 (darker shades means higher SPI score). Source: SPI

This is how the world is doing in social progress in 2016 (darker shades means higher SPI score; grey means no data). Source: SPI

Digging down to regional level

In practice, indeed, the differences within countries are more important than between countries. More granular data at the regional and local indeed provides a lot more hands-on information to policy makers on where, and how exactly, they can do better. And the Brussels capital region may be better compared to another large city, like Hamburg, then to the province of Belgian Limburg, which in turn could learn more from a region of similar GDP as East Anglia.

That’s why both the OECD and the SPI have been complemented with data on regional level. In 2016, the SPI launched a pilot overview of the 272 regions in the EU. The Commission has released the data of the exercise in February, and an updated version is due to come out in October. And where OECD uses only 11 indicators, the European regional data provide 50 out of the original 53 of the SPI. They also built in the peer group comparison in the methodology.

Once we start comparing regions with each other in Europe, very quickly the next question comes: will the unprivileged regions get more money to bridge gap?Conceptually, one could argue that using the SPI data to address specific low performance areas is a good way to aiming investment at the area where progress can be made. But money is sensitive, and in presenting the data, the Commission has been crystal clear that it doesn’t want to revise this funding policy. Nonetheless, the granular data can provide what is necessary: a better way to measure a good, regional, society.

How is Brussels doing? A bit of under-performance compared to Hamburg, Prague, Vienna, and similar regions. Source: European Commission/Social Progress Imperative

How is Brussels doing? A bit of under-performance compared to Hamburg, Prague, Vienna, and similar regions. Source: European Commission/Social Progress Imperative

The Netherlands’ first step to a happiness machine

In the three years I’ve been writing this blog, I’ve travelled around the world to explore happiness: from Denmark to Mexico and Bhutan, and from Costa Rica to the United States (well, the latter two only in spirit). But so far, I never wrote about my own home country, the Netherlands.

That’s not because there is no interesting debate on happiness in the Netherlands. The Netherlands always scores high in the international rankings (seventh in this year’s World Happiness Report, and fifth last year). It is home to the first Happiness Professor, Ruut Veenhoven. He was one of the first academics to seriously study happiness and his university hosts the World Database of Happiness (I’ve been told their team has identified 963 ways that have been used to measure happiness). A Unicef report often quoted in press demonstrates that Dutch children are the happiest ones of the (rich and developed) world. And beyond that, I’ve come across a lot of great projects on happiness, from happiness budgets for socially deprived people to happiness trainers and from happiness in civil community work to activists for environmentally sustainable happiness. The Dutch appear to be a happy few!

Happy people, happy state?

But does all this manifested interest mean in academia and society mean that also the national government is interested in understanding and enhancing the happiness level of its population? That is not the case. Prime Minister Mark Rutte famously stated that:

The State is not a happiness machine

What does Rutte mean by this? From the 1960s to the 1980s or even longer, many  in the Dutch political elite believed in the idea of socially engineered society, or in Dutch, the ‘maakbare samenleving’ (‘society that can be made’). This idea presupposed that government intervention could achieve a lot to improve people’s lives, the quality of society, and happiness levels. Over time, in the Netherlands like elsewhere the mood has shifted to a society where people are responsible for their own lives and the state does not interfere with people’s personal sphere. Happiness, or quality of life, is seen as a purely personal issue.

In my view, that is too simplistic. In the Netherlands like in Denmark, it just appears that we are getting many factors right. Neither Denmark nor the Netherlands has comprehensive happiness policies, but in both countries the quality of education, healthcare, social security, and trust are amongst the highest of the world. That is something to cherish, but rather than an endpoint, it should be something to build on.

Happiness through reports (or biscuits!)

Instead of developing a vision and a framework on quality of life – such as in Bhutan’s Gross National Happiness, but also in the UK’s government’s programme to measure well-being, the Netherlands has resorted to another strategy: happiness by reports!

It isn’t the only one to do so. The French Sarkozy government commissioned the appraised but never implemented 292-page report on the measurement of economic performance and social progress. The German Parliament outdid the French Committee: it published its own report of no less than 844 (!) pages on Growth, Wellbeing and Quality of Life).

Dutch 'stroopwafels' biscuits, a way to happiness? I'd probably subscribe to that view. Source: image found on Pinterest

Dutch ‘stroopwafels’ biscuits, a way to happiness? I’d probably subscribe to that view. Source: image found on Pinterest

The Dutch Committee ‘Broad Concept of Progress’

The Dutch response came this year. In April, a Parliament Committee published its own report ‘Broad Concept of Progress‘ (Breed Welvaartsbegrip), which it managed to keep just below 100 pages. The Committee set out in an exercise with three aims: to determine what GDP measures and doesn’t measure, whether there is value in broader concepts of progress, and to propose what these concepts should look like.

The Committee does see value in using broader concepts, and evaluates international efforts, like the OECD’s Better Life Index, the EU’s Beyond GDP agenda, or statisticians’ guidance aiming to measure subjective well-being in a more harmonised way. At the same time, it acknowledges the efforts are still very divergent. The report also points the work in the Netherlands itself via the Monitor Sustainable Netherlands (Monitor Duurzaam Nederland) prepared by the Dutch Statistical Office and three advisory bodies.

Monitor wellbeing broadly

Ultimately, the Committee does not make a clear choice in answering the question how progress should be measures. Instead, it comes with three recommendations. Firstly, to broaden the Monitor Sustainable Netherlands to turn it inot a Monitor Broad Wellbeing, and provide annual updates of the level of general wellbeing in the Netherlands. Secondly, these annual reports shouldn’t end up in a drawer or the fireplace, but be debated with the government in a parliamentary debate. And finally, the Dutch government is called to contribute to the convergence of all various international efforts in wellbeing indicators.

The report doesn’t contain a great ambitious vision, but aims to set a pragmatic and practical agenda. In a debate with MPs today, the Committee seemed to have support for this approach. Hopefully, the Netherlands is making a good choice today. There’s merit in not entering too deeply into the ideological discussions on metrics, as these often arise in arguments of the kind of ‘my index is better than yours’. Instead, by putting the issue on the agenda annually and contributing to find an end in the international labyrinths, the Netherlands may slowly edge closer to develop a vision on happiness.

A trip of one thousands miles to happiness starts with the first step. Even if the Dutch state won’t be a happiness machine anytime soon, it has started a journey.


The Nanny State: repression of happiness?

It’s a pedagogic dilemma all parents will face: should we be strict to our children and prohibit them to do things that are bad for them? Or should we give them the freedom to learn for themselves that sand is not tasty, that you can fall if you climb a tree and that a drink too many has dire consequences the next day?

At the state level, similar dilemmas arise. Social-democrats traditionally don’t scare away from a dose of paternalism to educate citizens. Libertarians, on the other hand, abhor states that coerce a certain type of behaviour. Which recipe works best to develop a happy society?

Two weeks ago, I addressed the question “does size matter” – when it’s about the size of the state and happiness levels, that is. The evidence indicated that some of the happiest states are smaller countries, and that after a certain level? There is – surprisingly – a positive correlation between higher tax and higher life satisfaction. Does that also mean that a more active government, a Nanny State, could contribute to higher levels of happiness?

Nanny State Index

Republicans in the US and liberals in EU States – such as Dutch PM Rutte – agree on one thing: big government is big enough, and the state shouldn’t interfere too much with individuals’ life. That’s also the thought behind the Nanny State Index. It has been developed by liberal or libertarian think-tanks, and maps the strictness of regulation affecting personal choice in the 28 countries of the EU.

The Index lists four areas: e-cigarettes, tobacco, alcohol, and food. There is quite a difference in the freedom of access to this products across the EU. For instance, in Sweden alcohol is only available in state stores and e-cigarettes are effectively prohibited in Belgium.

Altogether, two of the paternalistic Nordics, Finland and Sweden, top the list. They stay ahead of UK and Ireland. As a result of strict rules on tobacco and so-called ‘sin taxes’ on unhealthy foods and drinks, Hungary completes the top-5. Denmark, which one might expect to be in sync with paternalist Nordics, only ranks 12th. On the lower end of the scale, we find Netherlands, Luxembourg, and Germany. The freest country of all is… the Czech Republic.

Nanny State Index. Source: www.nannystateindex.org

Nanny State Index. Source: www.nannystateindex.org


Does repression, or freedom, bring happiness?

Is there any correlation visible between being a nanny and low and high happiness levels? The evidence is difficult to interpret: the three top-1o countries of the World Happiness Report rank at different places in the Nanny State Index. Swedish is on top of the list, the Netherlands at the bottom, and to confuse the picture further, Denmark is mid-way in the table.

The implication might be the following. Policies may work out differently in different settings. It’s probably the same with children: all are different. Some kids will exploit freedom and end up in troubles; other will feel their confidence strengthened and will be good and happy citizens.

Does size matter: higher tax, happier countries?

One of the oldest questions in political philosophy is of course: does size matter? Or to phrase it more precisely for the aims of this blog, does the size of the state influence the level of happiness of its population?

There are two ways of looking at the questions. Firstly, does the size of population matter for the quality of life? And secondly, how large a role should the government play in society?

Small is beautiful

At least at the anecdotal level, the first question is relatively to answer. It appears that smaller countries, typically, have happier populations than larger ones. From a theoretical angle, that makes sense. If a country is smaller, it is more likely to have a more homogenous population, and people are more likely to feel close to each other. For instance, this would result in a better community life, one of the factors associated with happiness. A glance at the 2016 World Happiness Report shows that most of the top-ten countries are relatively small, with Denmark, Switzerland and Iceland in the top-three, and only Canada, Netherlands and Australia (numbers six, seven and nine) having a population above 10 million.

Schermafbeelding 2016-05-22 om 18.37.08

Father state makes you… happy?

There is a second way of looking at the question, though. Does the share that the government takes in the economy and society affect happiness levels? Is it the invasive Big Government or rather the freedom of the laissez faire night-watcher state that makes people best off?

A book by Benjamin Radcliff, The Political Economy of Human Happiness, suggests there are three ways of measuring state size when assessing the correlation: welfare spending; overall government spending; and taxation.

From a theoretic perspective, one could presume a link between government spending and happiness. For instance, welfare policies could be expected to provide the safety net to lower income and/or unemployed people, and therefore reduce inequality. Similarly, a large amount of government spending – for instance by providing free or subsidised education or healthcare – could result in higher happiness levels.

Indeed, the evidence assessed by Radcliff suggests this kind of link. His data shows that for one of the metrics, linked to welfare spending, countries scoring high on this indicator, happiness levels are above one point higher than low-scoring countries. He suggests that this contribution to happiness is double that of being married (being married is positively correlated with happiness), and three times the negative drag of unemployment. To give an example: if your baseline happiness is 7, living in a state with high spending would statistically increase your happiness to 8. Being unemployed would drag it down to 6,7. That’s the magnitude of the influence of the state size according to Radcliff’s evidence!

More tax, more happiness

Government spending doesn’t come for free. While taxation of citizens and companies isn’t the only source of income, it typically is the most significant one. Could it really be the case that being taxed more resulted in citizens being happier?

Again, the data suggest there is a correlation. Radcliff even states that “higher levels of taxation suggest higher levels of satisfaction with life”.

The graph here compares taxation levels (tax revenue as % of GDP) with happiness levels (life satisfaction), based on data from the OECD and the World Happiness Report quoted above. It shows an increasing trendline, associating a level of taxation of 20% in this group of OECD countries with a happiness level of around 6.5. All others thing equal, a level of 50% is correlated with a happiness level of around 6.8: some one thirds of a point higher across the trendline.

But not all others things are equal: the distribution is broad and the effects are very diverse. Denmark is on the top right with a happiness level of 7.526 and the very highest tax level of 50,9. On the far left, we find Switzerland with a marginally lower happiness level of 7.509 and only half the tax rate at 26.6%. On the lowest part of the graph, with happiness levels just above 5 points, we find Portugal, Greece and Hungary, with taxation levels around 34-38%.

tax vs happiness


Correlation, goes the warning to every first-year student, is not causation. The 34 countries of the OECD provide some interesting figures, but there are many other factors than taxation that determine happiness. Idiosyncratic factors and practical things like a state’s efficiency – what kind of society does is create with the 20 or 50% tax money it collects? – certainly also play a role. I’ll look at some of what the states does next week: the Nanny State.

Post Navigation