The population of the Netherlands is two-faced. When we are among ourselves, we like to complain: about our politicians, the weather, taxes, the healthcare system, declines in fixed jobs, and immigration. In this year’s elections, parties with populist policies won over 25% of the vote.
While we tend to be pessimistic about society as a whole, most people are very satisfied with their own lives. Despite our complaints, the Netherlands is one of the happiest countries of the world. Indeed, when we speak to foreigners, we paint a proud picture of our country. We speak of the Netherlands as a country that is hard-working but not too serious, innovative, well-organised, and with high standards of life. PM Rutte’s daily job is to tell Dutchmen they live in a ‘waanzinnig gaaf land’, which means something as a ‘madly cool country’. A Financial Times feature just before the elections broadly supported the claim.
Indeed, if we look at the stats, it is fair to say ‘The Netherlands second’, as the viral video presenting the country to President Trump did this year did. Dutch economist Mathijs Bouman mapped the Netherlands’ performance on a range of indicators, comparing various rankings on competitiveness, innovation and human development. His conclusion? The Netherlands is the best country of the world, second only to… Switzerland. Only when the World Happiness Report was added, the Netherlands jumped over the United States to second place.
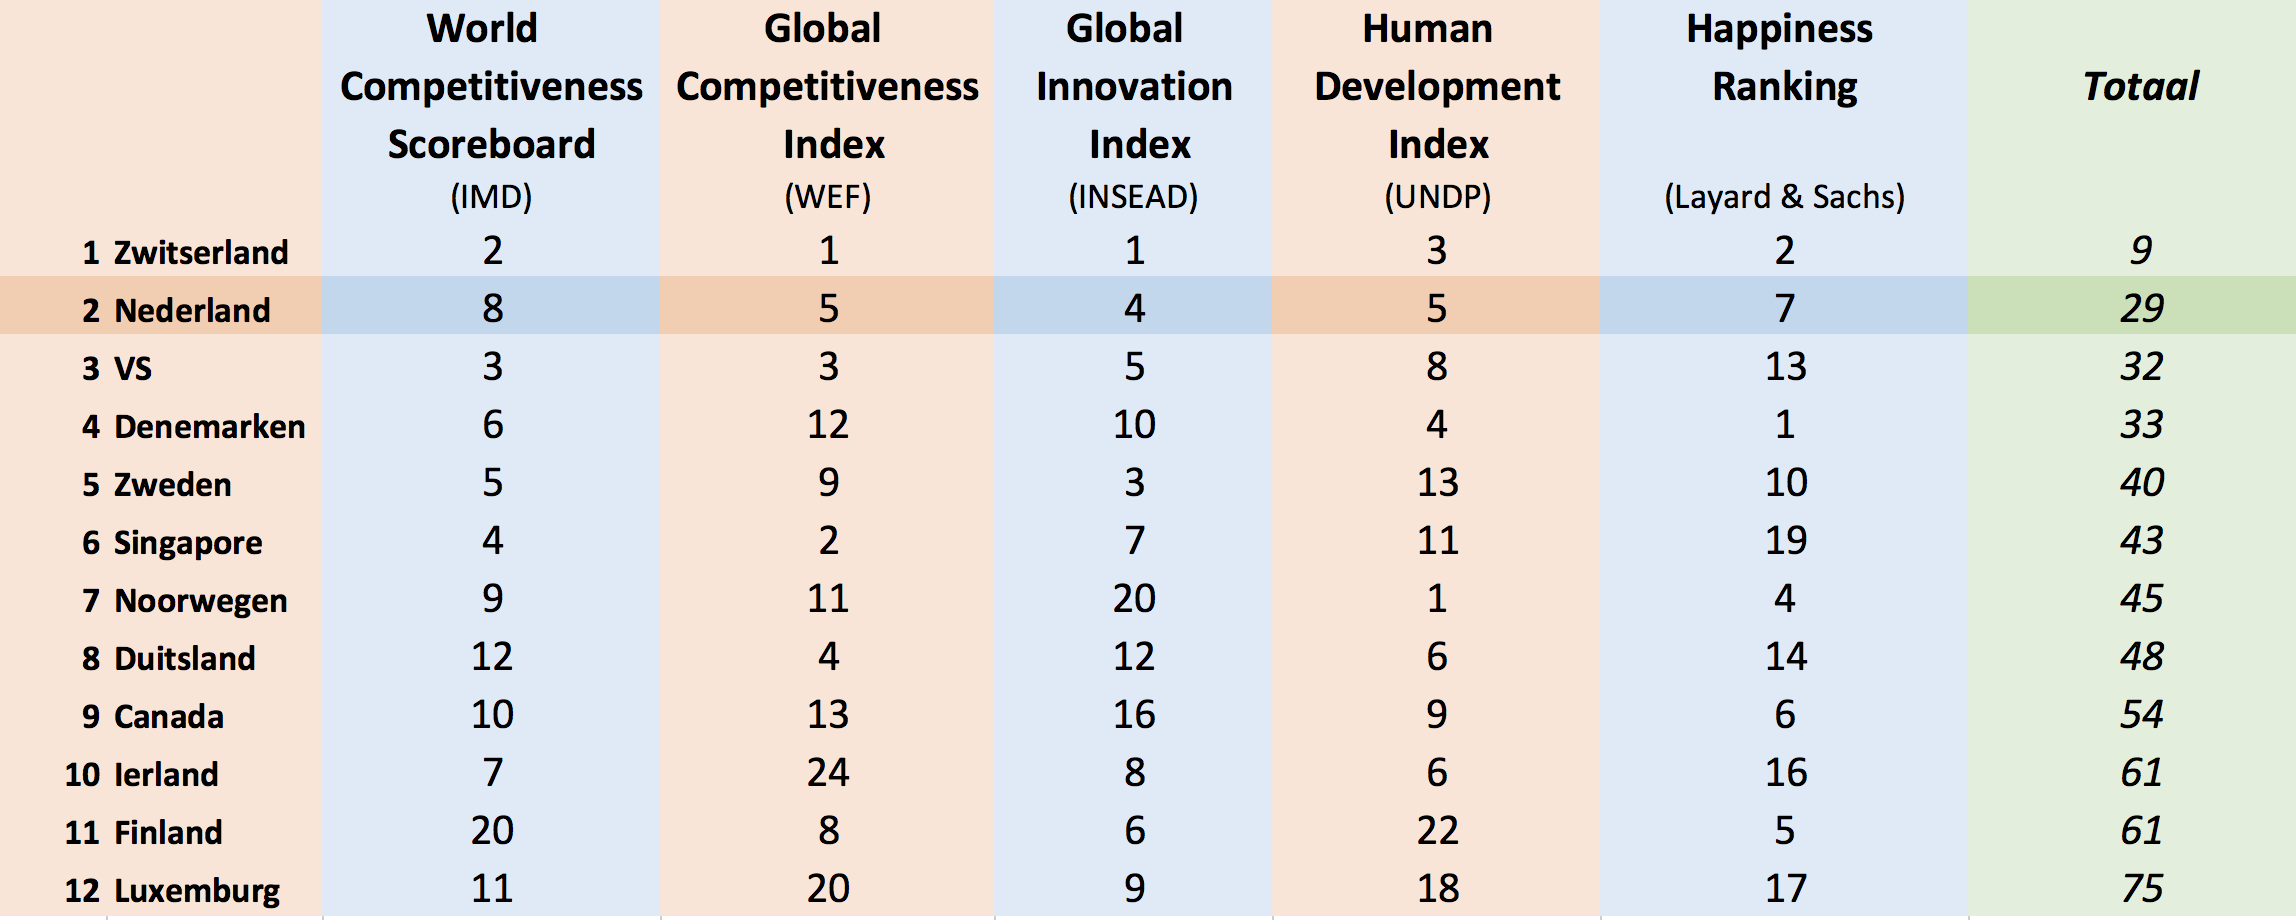
The Netherlands second. Source: Mathijs Bouman, http://mathijsbouman.nl/nederland-is-het-beste-land-ter-wereld-op-zwitserland-na/
Happiness: the last frontier
With good scores on so many levels, it is time to reach the last frontier: make society even happier. And the Dutch are getting to business: over the last years, society’s happiness and alternative indicators have gained more attention in the Dutch public debate. Last year, the Dutch Parliament supported steps to create a ‘Monitor Broad Well-being’, to better assess quality of life in the Netherlands.
A happiness atlas
Researchers and marketeers are also spending time on the topic. Recently, a study crowned the central Netherlands town of Ede the happiest city of the Netherlands.
The Atlas of Municipalities, prepared with the support of the Happiness Research Centre of the University of Rotterdam, compared happiness levels in the 50 largest towns. Mid-sized towns like Ede, Apeldoorn and Gouda rank to the top, while most of the larger cities like Groningen, Amsterdam and The Hague are on the bottom of the table. Rotterdam, the second-largest city, even closes the list of 50. The map below outlines the top-10 in turquoise, and the bottom 1o in red.
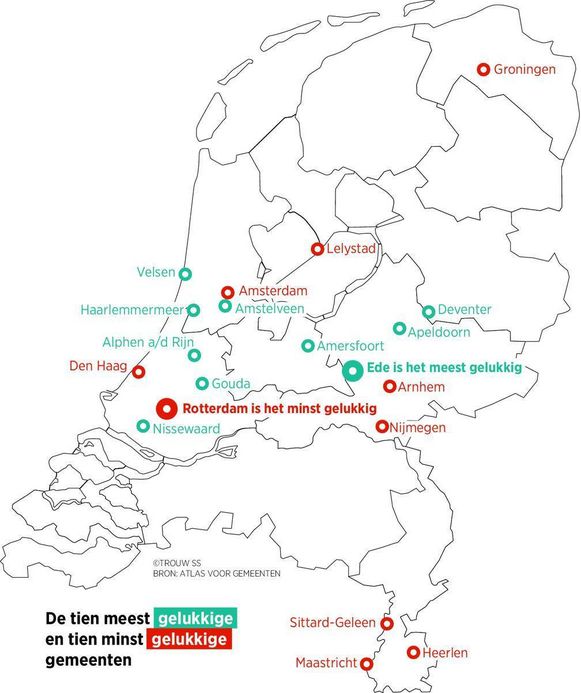
This map shows cities ranked 1-10 (in turquoise) and 41-50 (in red) in the Atlas of Municipalities. Source: Trouw, based on data of the Atlas.
https://www.trouw.nl/home/het-geluk-is-te-vinden-in-een-middelgrote-stad-ede~aeb4553a/
What is happiness, anyway?
Let’s dig in a little bit deeper into what this all means. First of all, what is happiness anyway? For the purposes of the study, it is “the extent to which an individual find satisfaction in their own life as a whole”. ‘Happiness’ is then measured via three metrics: an overall judgement of a respondent’s life satisfaction as a whole, the extent to which one is a happy human being, and the extent to which one felt happy in the last four weeks. Ede overall scored best at this, with 89% of the local population scoring at least an average of 7 out of 10 among the three.
Second, how is Ede different than others? The researchers identified seven factors that account for the differences in happiness levels across Ede and the other cities. These, include the size and composition of the population, the employment rate, health, religion, and the attractiveness of life in the city. That however doesn’t mean that Ede is the only city doing well on those factors, or on happiness. Overall, smaller cities tend to perform better than bigger ones: here, life is less chaotic, while there is more on offer than on the countryside.
Marginal differences
The differences between cities appear quite marginal and probably are not statistically significant. 17 out of the 50-sample score 88 or 89%, no fewer than 42 are in the 85-89% bucket, and even number last Rotterdam houses 82% of happy people. As such, the meaning of being ranked first, second, or even thirtieth, is fairly limited.
Other indices in the Atlas convey this point even more. The happiness index is only an annual theme of the Atlas, which annually compares cities on a range of metrics. Some of these metrics are pooled into indices, for instance mapping ‘attractiveness’ and social-economic performance.
The ‘attractiveness’ index aims to compare how attractive cities are as a place to live for the Dutch population. It looks at factors such as the jobs within range of the city, the share of owned and pre-war homes, distance to nature, and the culinary and cultural offer. The social-economic index, as the name says, looks at elements like employment, the population share on welfare and with low education levels, and the poverty rate.
Both rankings offer a radically different overview than the happiness ranking: ‘Happy’ Ede finds itself back at the 15th place as for its social-economic performance. ‘Unhappy’ Rotterdam is found a more attractive place to live than Ede (respectively 17th and 22nd on the attractiveness index).
Spotting strengths and weaknesses
The takeaway? Indices help to spot cities’ strengths and weaknesses, especially when you dig in the underlying data via the OECD-type dashboard approach the Atlas offers. But different measurements give different results. While it is fun to publish such rankings and see how our cities perform, one cannot a lot of value to small differences or annual movements in the Netherlands. And the key message remains that life in the Netherlands is good. We can be among 82% of happy fellow citizens, or among 89% in Ede. In this sense, the Dutch do live in a ‘madly cool country’, as Prime Minister Rutte said.