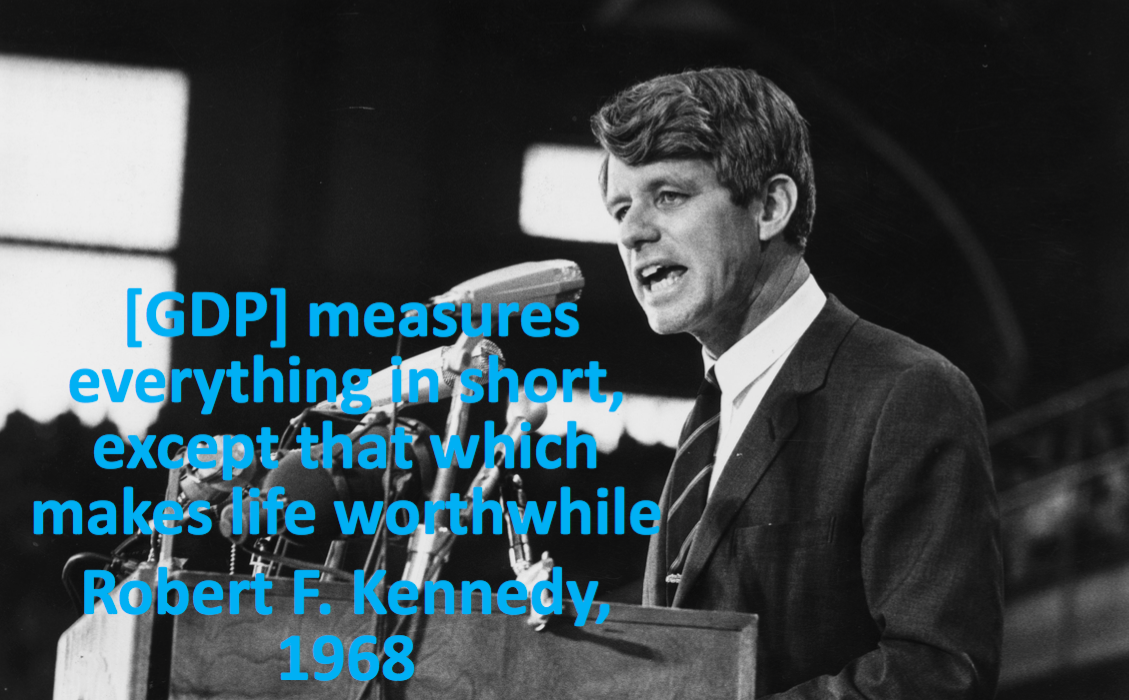
Tag Archives: Oecd

How’s life in 2017? Social divisions result in lower happiness, finds OECD

How’s life?

It’s not only mother or your colleague who’s asking from time to time. Policymakers are interested, too.

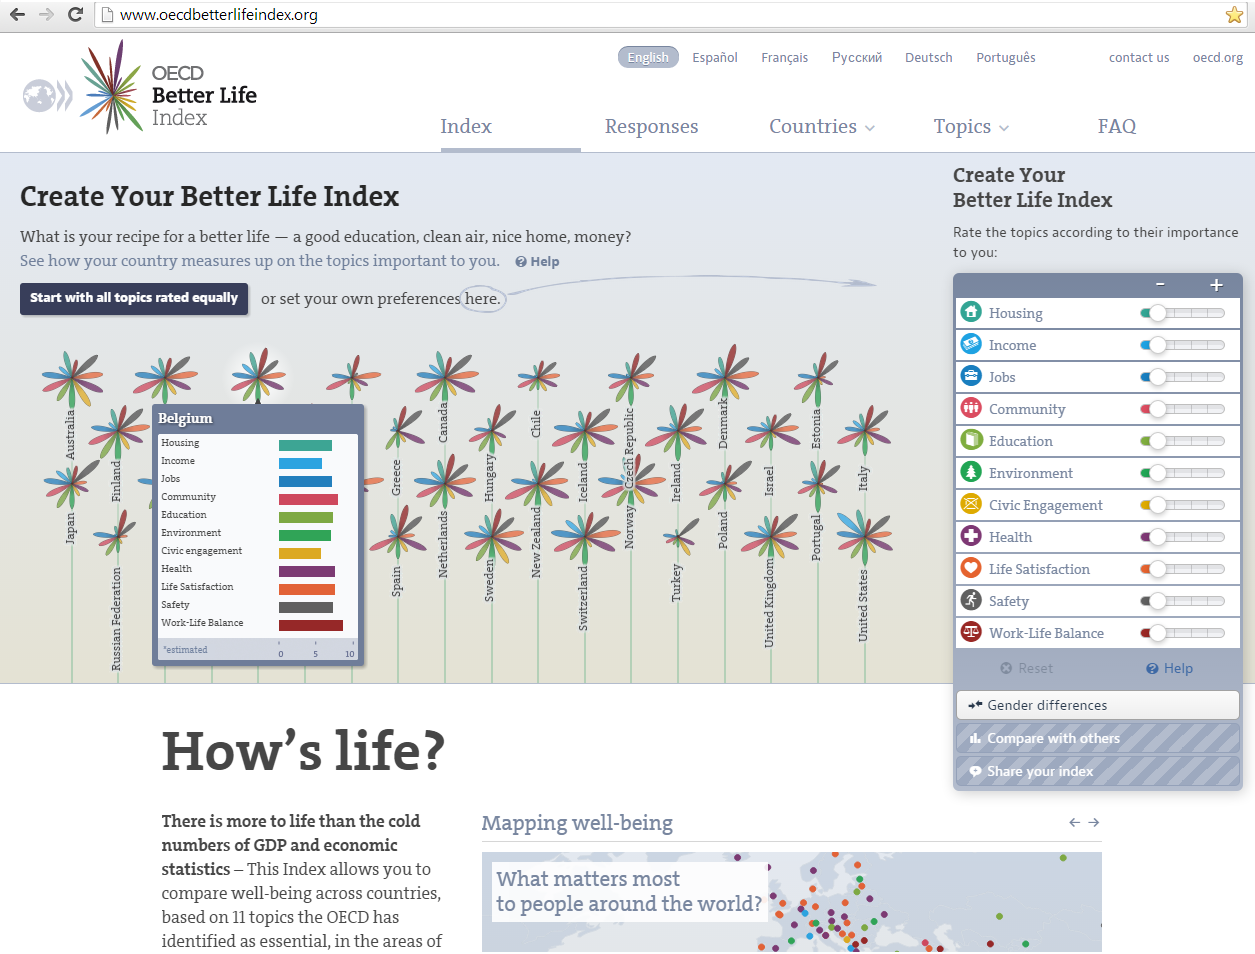
The Organisation for Economic Cooperation and Development (OECD) every year comes with thick studies to answer the question. Earlier this month, the 2017 edition was published, mapping how people in OECD countries feel about a bunch of things: jobs, health, safety, life satisfaction, and so on. Altogether, the datasets cover eleven broad indicators of the OECD Better Life Index.

These studies are important. Data is power, and having information on how people feel matters a great deal to making the world a better place. As the OECD says it: it helps achieving well-being for all.

So, how do we feel?

The answer is 6.5.

That is, on a ten-point scale, is the average life satisfaction for 2017, marginally lower than the 6.7 score shown in 2005. The small decline probably results of the interaction of a few steps forward and a few step backwards. For instance:

    • Incomes and earnings went up, by 8% and 7% respectively. But inequality remains strong: 1/3 of people would go in poverty if they had to miss three months of salary.
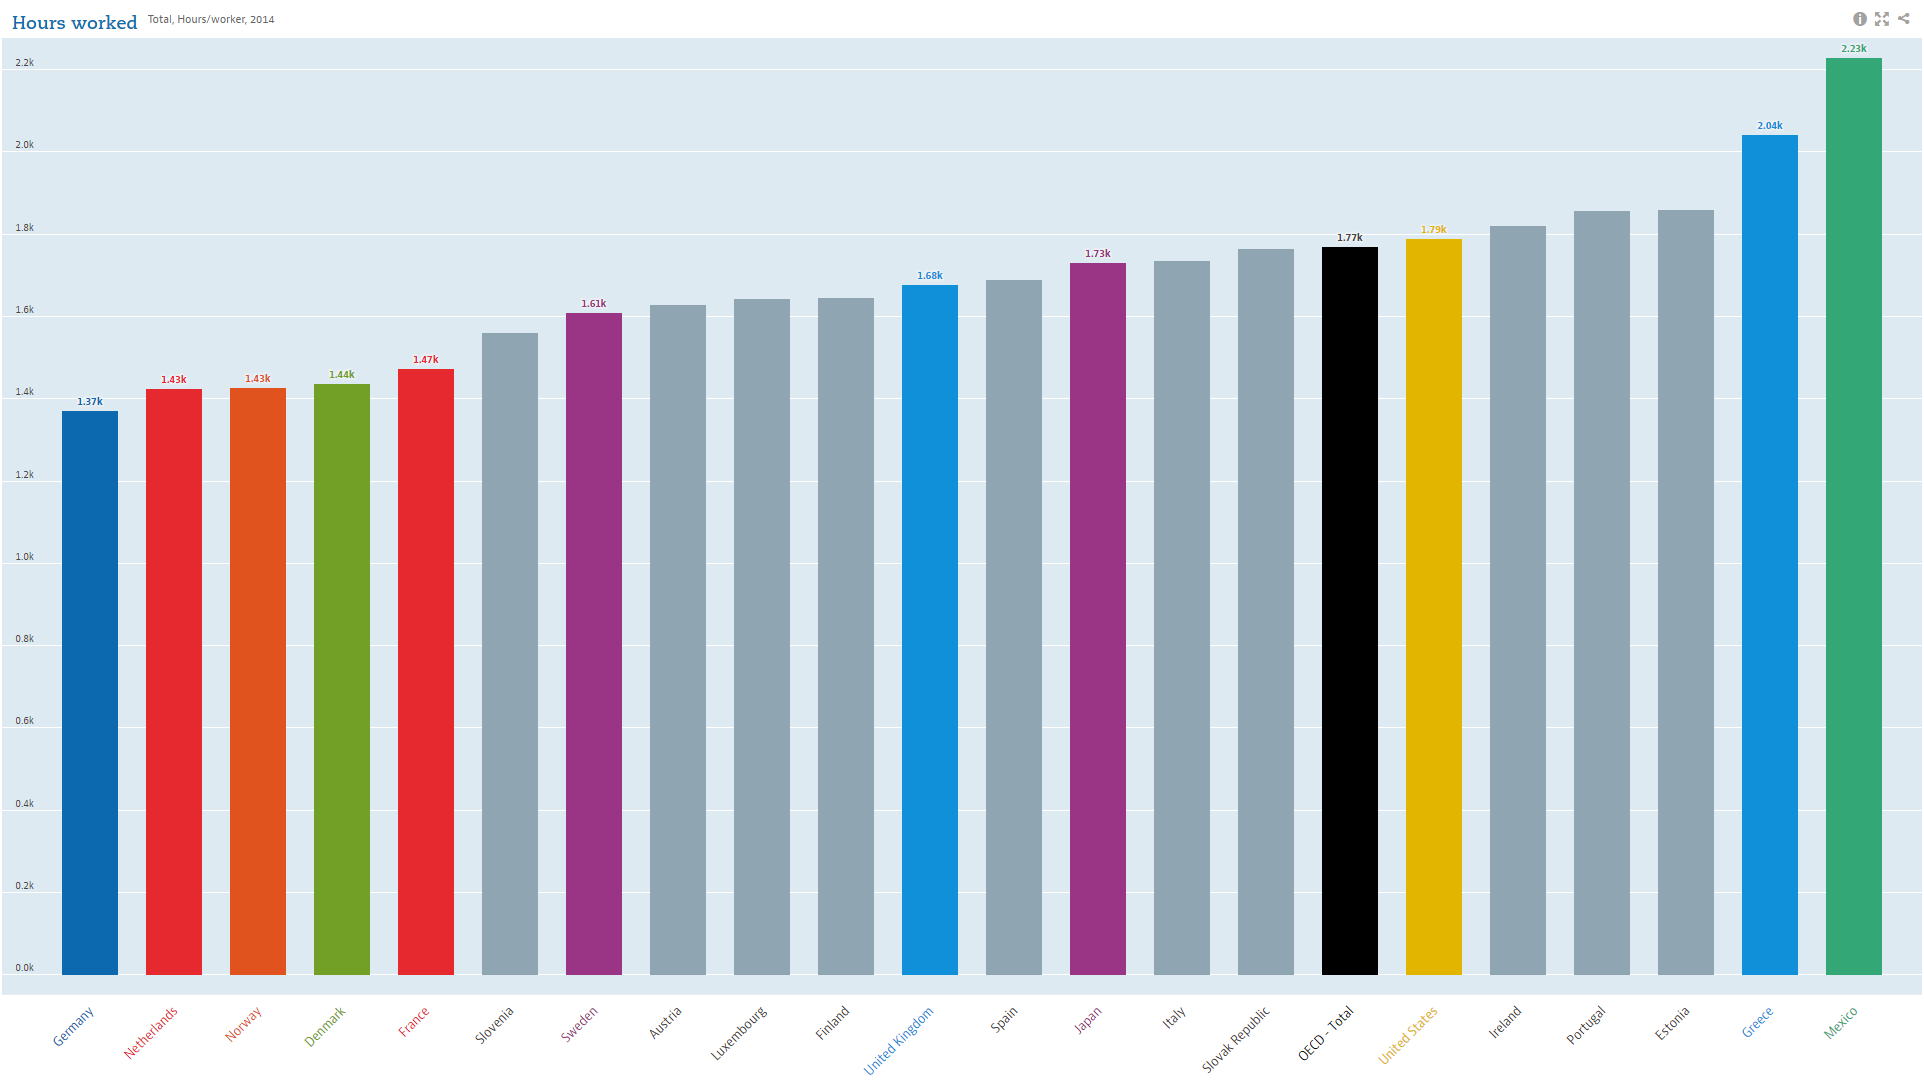
    • The employment rate went up by 1.3 percentage points, and working hours improved in most countries. But long-term unemployment got worse in half of the countries.
    • Since 2005, the number of smokers reduced from 22% to 18%. But the number of obese people increased from 22% to 24%.
    • Education levels see strong improvements. But voter turnout and trust in government decline in more than half the countries.

Well-being for all

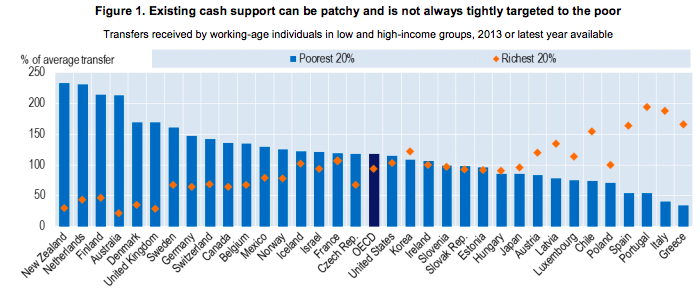
A large part of the 2017 report is dedicated to equality. While debates about inequality are often about wealth and income, the OECD believes that inequality is felt in every area of our lives.

For instance, the richest 20% are advantaged in many well-being indicators:

  • Rich people spent 11 times more time on social activities than poor people
  • The top-20% has 5-fold higher household income than the bottom-20%
  • Life satisfaction is twice as high
  • And poorer people tend die a lot younger: the standard deviation in age at death is 13 years

And as a special section of the report shows, migrants particularly tend to be worse off.

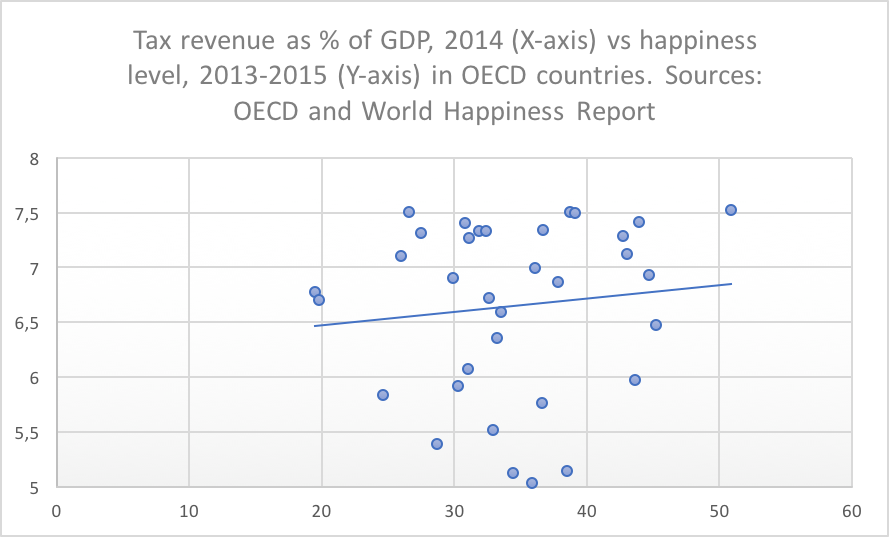
This all matters, because more equal societies tend to be happier ones. While the situation is a bit scattered, there is some correlation between income equality and life satisfaction. In OECD data, the correlation is even stronger when inequality is plotted against the broad well-being indicators.

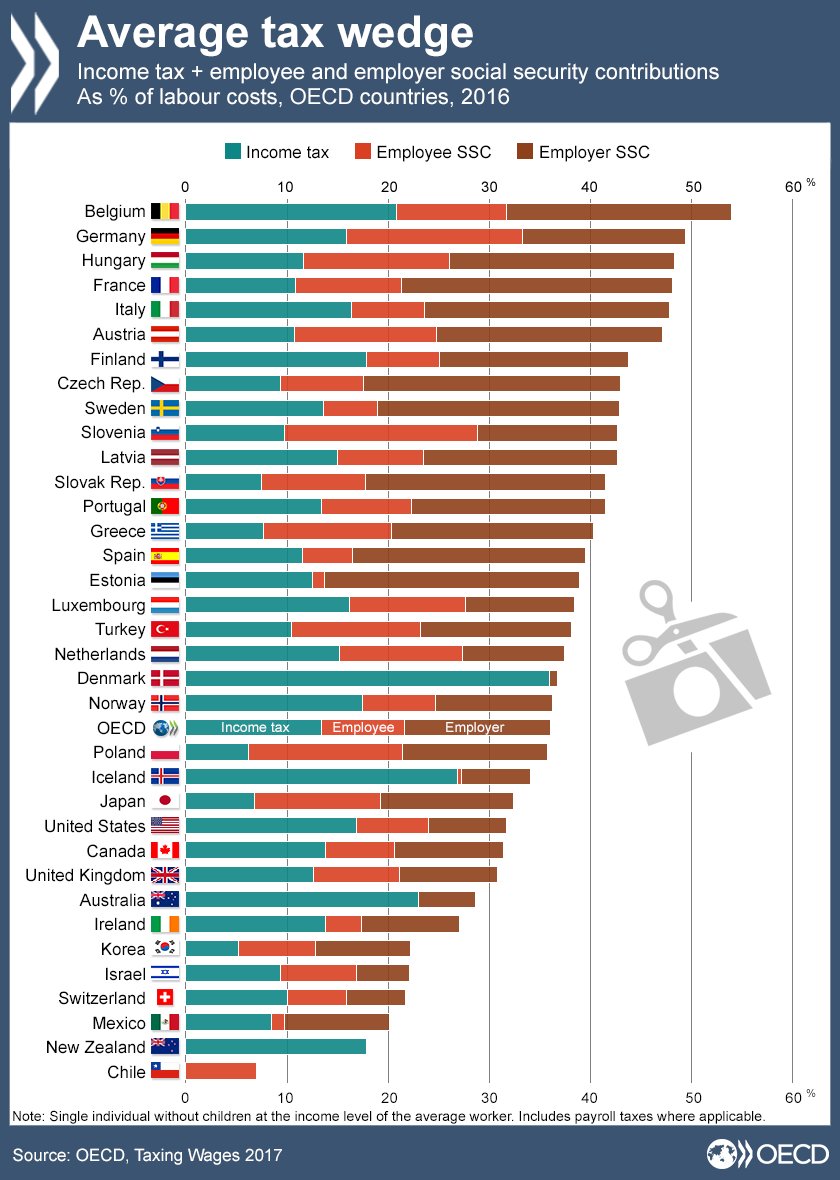
The American Dream vs Janteloven

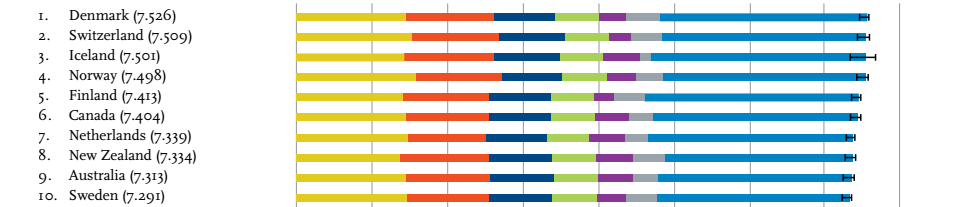
Take the examples of the United States and Denmark. If you are successful in life, you can have all the American dream. The US is a ‘winners’ society: it is an extremely rewarding environment to build a business and prove yourself. Income taxes are low, and healthcare and social security provisions are bare. At the level of society, the payoff in happiness is not too high. America ranks 14th in the World Happiness Report, with an average below 7 out of 10. Not that great, one might say.

Denmark, to the contrary, is a society that also wants to make ‘losers’ thrive. It offers a strong social security system, that’s even a factor contributing to high happiness. Denmark also wants to offer a good life to people that ‘fail’ in life. Indicative for the Danish way of looking at success is the ‘Janteloven’, or Law of Jante. Janteloven is a list of ten rules that basically boil down to: don’t imagine you’re someone, we’re all the same, and you’re not worth anything. Though, depressingly, the sense of equality it instills helps contributing to a balanced, and happy, society. Denmark often ranks on top of the happiness list, finding itself back at 2 in 2017.

Data to learn from

Either way, Americans and Denmark are both as they are. Even cultural differences in our thinking about inequality could affect our happiness. Beyond books and articles about hygge, reports like the OECD one help to learn from each other. It feels naive to write this down, but the United States can become a little bit more like Denmark. And among the wealth of data, Denmark can also find some inspiration in how people in the US pursue happiness.

View of Nyhavn, Copenhagen.

View of Nyhavn, Copenhagen.

Basic income, revisited: the Finns are on it!

Until recently, I lived and worked in Belgium, and benefitted from a benevolent state taking care of me. I received lunch vouchers for around €100 to €150 a month. Plus ‘ecological vouchers’ for organic products or train travel. Plus ‘sports and culture’ vouchers, for, well, sports and culture. My monthly contribution to the public insurance fund came in at a very modest €8,00, and my own contribution for most treatments was fairly low. Had I lost my job, there would be an expansive social security system where I could get support. Sounds good, doesn’t it?

Well, I spent my time in one of the most heavily taxed countries of the world. Relatedly, Belgium ranks on top of the list across the OECD as for the labour costs – income tax, and employees and employers’ social security contributions. Over half of the wage costs of a Belgian employer account for income tax and social security contributions. Or in other words: it costs over €4,000 to have an employee with a take home pay of €2,000.

Tax wedges in OECD countries. Source: OECD

Tax wedges in OECD countries. Source: OECD

Basic income, revisited

Even if you agree with the noble goals, and despite the correlation between high taxes and happiness, wouldn’t it be a lot better to remove this money pumping function of the state? If a tax reform increased  my net salary by the same amount, I’d have happily foregone all my vouchers and started paying an amount closer to the real cost of my insurance. Sweet and simple!

Last year I already wrote about the possibility of using basic income as a tool to simplify social spending. At the time – just after the Swiss voted ‘no’ in a referendum on the subject – I saw the possibility to get rid of series of tax breaks and charges that have little more effect than creating employment for tax collectors on the one side and tax consultants on the other.

Two things made me revisit the issue. Firstly, the policy discussion on basic income has advanced: more studies have been produced, and Finland’s experiment is underway. Secondly, we are getting a better picture on how basic income can help us solving social problems around globalisation and automation (the robots are coming, and they may give us the cash we need!). Let me take the second issue in a later piece, and look at the policy discussion now.

The Finnish experiment

Finland’s national experiment with basic income launched in January 2017, and contrary to other recent tests has nationwide coverage. 2000 selected Finns now get a monthly sum of €560 – no questions asked. That’s a modest amount, compared to the €2,500 national average wage. It’s not universal basic income per se, though. The participants are all unemployed; typical employees and billionaires don’t get basic income. Kela, the Finnish social security body that organises the experiments, deducts basic income from other social spending, so that basic income mostly replaces existing tools. Despite these limits in scope, the basic income is fully unconditional: participants are free to spend the money any way they like.

While Kela is clear that conclusions will only be reported after the end of the experiment, initial feedback confirms earlier anecdotal evidence that basic income increases the sense of freedom and happiness. Vice went to speak to Juha Järvinen, an artist who feels basic income allows him to focus on what he enjoys: creating the shaman drums that he sells. For Järvinen, the money is not the main advantage of the experiment: “you need to be a magician to survive” on €560 a month in Finland. Instead, it’s the fact that the employment office is not at his back all the time that gives him a sense of liberation. The basic income provides a first basis that makes it easier to undertake the project he likes. He recognises that with this level of spending a beneficiary couldn’t simply be lazy and do nothing, as some adversaries of basic income fear.

Left-wing and right-wing basic income

The Finnish government is a centre-right one, and this is visible in the design of the experiment. Typically, many proponents of basic income are centre-left, focusing on the benefits basic income offers to personal freedom and development, and quality of life. From a left-wing perspective, basic income is about citizens’ rights and distribution of state means. Basic income could then be a tool to ensure that citizens have equal possibilities, and that people of poorer or minority groups are not worse off.

The centre-right perspective would rather emphasise simplification and reduction of state spending. Basic income could replace up to 100 tax incentives in the Finnish case. This is also a key condition to ensure that basic income remains affordable, they argue.

Can we pay it?

That begs the critical question: can we afford basic income? The low Finnish basic income is set up with affordability in mind. It’s not an easy question. The answer of the advocacy group, the Basic Income Earth Network (BIEN), boils down to ‘it depends‘: if we narrowly redistribute existing benefits, it could work. However, if we maintain all existing benefits and then add a broader basic income for everybody to live comfortable, governments will struggle to find the means.

Is basic income better than current social spending?

The Organisation for Economic Cooperation and Development (OECD) weighed into the debate via a study outlining a slightly different question: does basic income reduce poverty and increase equality? The study started with the observation that social expenditure is targeted in wildly different ways. As of 2013, the 20% richest in the average OECD country benefitted only marginally less from cash transfers than the 20% poorest. In most countries, the poor obviously benefitted more from transfers than the rich. But in a few countries, particular subsidies worked out in a net transfer from everybody else to the rich, including Greece, Italy, Poland, and Portugal.

Beneficiaries of cash transfers in OECD countries, 2013. Source: OECD

Beneficiaries of cash transfers in OECD countries, 2013. Source: OECD

So, does basic income do a better job? According to the OECD, it probably doesn’t. If basic income were to be set at the level of current spending –  a narrow basic income – it would remain below the poverty line across all OECD countries, sometimes staying far below. Not surprisingly, if you consider that at present only a share of the population benefits from public spending. As such, basic income would risk distributing from the poor to all. Then, it could draw similar criticism as some education grants do: funds paid for by the baker and the electrician to finance the career investment of the lawyer’s son.

Redistribution from the poor to all

Looking at modeling of how basic income could work in Finland, France, Italy, and the UK, the study finds that a narrow basic income indeed would not reduce poverty. Rather than sharing wealth, the changes in public expenditure would redistribute poverty along different lower-income groups. As such, simply pooling existing benefits and reallocating them as basic income is not the right solution. But there might be other ways – maybe robots could come to rescue? That, however, is a topic for another post. See you later!

A world beyond GDP: are we ready yet?

On the road to discover how happiness works, I learned a lot about happiness in my own personal life – and in your personal lives, too. I’ve also gained a lot of insight in happiness at work. But the main focus of my research effort has been around another question: is there something our governments can do to make us happy?

Allow me to dwell on this question today, before I start my ‘sabbatical’ as a blogger.

I am sure that governments can make us happier, and that they should aim to do so. There are many governments that are taking happiness-based data into account when setting policies. Gross National Happiness (GNH) in Bhutan is more of philosophical guide than a hands-on policy tool, but it shapes the narrative of the government’s action. Regions in the EU and elsewhere learn from the OECD Better Life Index and Regional Well-Being Index and from Social Progress Index (SPI). And on the local level, there is an uncountable number of projects where municipalities and social society players take happiness as inspiration in social, environmental and other projects.


GDP, an increasingly poor measure of prosperity

On one of the bigger and more abstract questions I have countered on the road is whether our data helps us to work on happiness. I’ve time and again argued that Gross Domestic Product (GDP) has plenty of limitations. Instead, I assessed the virtue of alternative indicators mentioned above. And I have been far from alone in this endeavour. Back in 1968, Robert F. Kennedy already decried that GDP measures everything, except that which makes life worthwhile. In the last ten years, the debate on ‘beyond GDP’ has been particularly fierce. A cover article of the Economist some months ago summarised these limitations very well, and labelled GDP “an increasingly poor measure of prosperity”.

Can we do without GDP? Does the acceptance of the constraints of GDP mean that a real competitor has risen to the stage? Did we get anywhere in those ten years?

After three years of researching, I fear that my answers: no, we cannot yet do without . No, there is no real competitor. And no, maybe we haven’t made as much progress as we like to think. In the remainder of this post, I explain why.

Kennedy GDP


Can we do without GDP?

Ever since its creation in the 1930s, GDP provides important information about national accounts and the size of the economy. It simply measures all production that has been created in a certain territory in a year. These data are important to inform decisions on investment, government spending, and taxation. But all too often, GDP becomes a proxy for progress or prosperity. As a tool, it only measures part of productive economy: GDP falls when a man marries his maid. Indeed, if they don’t increase the economy, GDP discounts social and environmentally desirable activities, such as household work.

Furthermore, GDP is an artificial number. Figures are routinely revised, often upwards and by large margins. After a new method is used in Ireland, GDP growth is not an already significant 7.6% over 2015, but a whopping 26% as a result of some accounting tricks. Imagine the consequences: in terms GDP per capita, Irish are suddenly a lot richer, and the budget deficit shrinks by the stroke of a pen!

Despite all these limitations, GDP is probably a bit like democracy. In Churchill’s words, democracy is the worst form of government, except for all the others. We still need GDP as a tool to measure economic activity, to make sense of poverty, and to determine how much tax we need to pay to run our common society. It might still be the best we can do?


Is there any competition?

Or can we? In this blog, I’ve covered many alternative indicators, from GNH to the OECD Better Life Index to the SPI, but also the UN’s Humanitarian Development Index and even the Happy Planet Index. In my view, these are good as part of driving the narrative for a broader sense of well-being and progress. Tools like the OECD Better Life Index, GNH and the SPI can be helpful in spotting where governments need to focus resources to increase quality of life.

But they aren’t appropriate for all economic purposes. All indicators have a stronger element of arbitrary and political choices. As such, they’re too political to be used in a more economic context. Countries simply would refuse to determine financial contributions to the United Nations based on performance in the HDI, or EU regional funds based on a regional SPI score. GDP too often is seen as the more ‘objective’ metric, and even though it is not objective or stable, it is doing better than alternatives. Intriguingly, GDP is also strongly correlated with performance like HDI and SPI, even around 80% for the latter index. Although the SPI is making advances in feeding into policy, altogether none of the indices is truly challenging the position of GDP as things stand in 2016. And I don’t think it will be very different in 2018, 2020, or 2025 for that matter.


Did we make so much progress?

Then, how much progress did we make in several decades of an academic debate, and overall ten years of statistical revolution? A lot has happened. Our insights in quality of life and happiness is a deeper than at any moment in history. OECD statistical offices are now routinely gathering data on subjective wellbeing, and there is a vibrant research agenda in positive psychology and related fields. Academics and practicioners, myself included, happily travel to Bhutan to learn about GNH.

But what was generated out of this debate? Are we paying more attention to quality of life after the financial crisis? A single indicator truly competing with GDP has not been born. UN and EU authorities, as well as national governments and parliaments, have underlined the importance of alternative ways of measuring progress. But the reign of GDP has never been in danger. My feeling is that GDP is simply too important, and the alternatives too complex. I fear that we’re not ready for this revolution yet.


Time for a sabbatical

Three years on the road, my doubts on the alternatives to GDP are back. I see the beyond GDP agenda as a powerful discussion, but one that has not generated a strong enough alternative to truly challenge GDP.

On a personal level, this means that a reflection on my work is needed. Do I need to focus on something else? Do I need to work harder, or differently, for a state of happiness? Did I fail myself?

For the moment, I’ll take a break from this blog. I’ll reflect on other steps. I deserve to take some time off for a sabbatical to read more and generate other ideas. But I am sure I’ll be back with a new programme.

Because a life, enjoyably wasted in the pursuit of happiness, is a life worth wasting. Farewell!

The Netherlands’ first step to a happiness machine

In the three years I’ve been writing this blog, I’ve travelled around the world to explore happiness: from Denmark to Mexico and Bhutan, and from Costa Rica to the United States (well, the latter two only in spirit). But so far, I never wrote about my own home country, the Netherlands.

That’s not because there is no interesting debate on happiness in the Netherlands. The Netherlands always scores high in the international rankings (seventh in this year’s World Happiness Report, and fifth last year). It is home to the first Happiness Professor, Ruut Veenhoven. He was one of the first academics to seriously study happiness and his university hosts the World Database of Happiness (I’ve been told their team has identified 963 ways that have been used to measure happiness). A Unicef report often quoted in press demonstrates that Dutch children are the happiest ones of the (rich and developed) world. And beyond that, I’ve come across a lot of great projects on happiness, from happiness budgets for socially deprived people to happiness trainers and from happiness in civil community work to activists for environmentally sustainable happiness. The Dutch appear to be a happy few!

Happy people, happy state?

But does all this manifested interest mean in academia and society mean that also the national government is interested in understanding and enhancing the happiness level of its population? That is not the case. Prime Minister Mark Rutte famously stated that:

The State is not a happiness machine

What does Rutte mean by this? From the 1960s to the 1980s or even longer, many  in the Dutch political elite believed in the idea of socially engineered society, or in Dutch, the ‘maakbare samenleving’ (‘society that can be made’). This idea presupposed that government intervention could achieve a lot to improve people’s lives, the quality of society, and happiness levels. Over time, in the Netherlands like elsewhere the mood has shifted to a society where people are responsible for their own lives and the state does not interfere with people’s personal sphere. Happiness, or quality of life, is seen as a purely personal issue.

In my view, that is too simplistic. In the Netherlands like in Denmark, it just appears that we are getting many factors right. Neither Denmark nor the Netherlands has comprehensive happiness policies, but in both countries the quality of education, healthcare, social security, and trust are amongst the highest of the world. That is something to cherish, but rather than an endpoint, it should be something to build on.

Happiness through reports (or biscuits!)

Instead of developing a vision and a framework on quality of life – such as in Bhutan’s Gross National Happiness, but also in the UK’s government’s programme to measure well-being, the Netherlands has resorted to another strategy: happiness by reports!

It isn’t the only one to do so. The French Sarkozy government commissioned the appraised but never implemented 292-page report on the measurement of economic performance and social progress. The German Parliament outdid the French Committee: it published its own report of no less than 844 (!) pages on Growth, Wellbeing and Quality of Life).

Dutch 'stroopwafels' biscuits, a way to happiness? I'd probably subscribe to that view. Source: image found on Pinterest

Dutch ‘stroopwafels’ biscuits, a way to happiness? I’d probably subscribe to that view. Source: image found on Pinterest

The Dutch Committee ‘Broad Concept of Progress’

The Dutch response came this year. In April, a Parliament Committee published its own report ‘Broad Concept of Progress‘ (Breed Welvaartsbegrip), which it managed to keep just below 100 pages. The Committee set out in an exercise with three aims: to determine what GDP measures and doesn’t measure, whether there is value in broader concepts of progress, and to propose what these concepts should look like.

The Committee does see value in using broader concepts, and evaluates international efforts, like the OECD’s Better Life Index, the EU’s Beyond GDP agenda, or statisticians’ guidance aiming to measure subjective well-being in a more harmonised way. At the same time, it acknowledges the efforts are still very divergent. The report also points the work in the Netherlands itself via the Monitor Sustainable Netherlands (Monitor Duurzaam Nederland) prepared by the Dutch Statistical Office and three advisory bodies.

Monitor wellbeing broadly

Ultimately, the Committee does not make a clear choice in answering the question how progress should be measures. Instead, it comes with three recommendations. Firstly, to broaden the Monitor Sustainable Netherlands to turn it inot a Monitor Broad Wellbeing, and provide annual updates of the level of general wellbeing in the Netherlands. Secondly, these annual reports shouldn’t end up in a drawer or the fireplace, but be debated with the government in a parliamentary debate. And finally, the Dutch government is called to contribute to the convergence of all various international efforts in wellbeing indicators.

The report doesn’t contain a great ambitious vision, but aims to set a pragmatic and practical agenda. In a debate with MPs today, the Committee seemed to have support for this approach. Hopefully, the Netherlands is making a good choice today. There’s merit in not entering too deeply into the ideological discussions on metrics, as these often arise in arguments of the kind of ‘my index is better than yours’. Instead, by putting the issue on the agenda annually and contributing to find an end in the international labyrinths, the Netherlands may slowly edge closer to develop a vision on happiness.

A trip of one thousands miles to happiness starts with the first step. Even if the Dutch state won’t be a happiness machine anytime soon, it has started a journey.


Does size matter: higher tax, happier countries?

One of the oldest questions in political philosophy is of course: does size matter? Or to phrase it more precisely for the aims of this blog, does the size of the state influence the level of happiness of its population?

There are two ways of looking at the questions. Firstly, does the size of population matter for the quality of life? And secondly, how large a role should the government play in society?

Small is beautiful

At least at the anecdotal level, the first question is relatively to answer. It appears that smaller countries, typically, have happier populations than larger ones. From a theoretical angle, that makes sense. If a country is smaller, it is more likely to have a more homogenous population, and people are more likely to feel close to each other. For instance, this would result in a better community life, one of the factors associated with happiness. A glance at the 2016 World Happiness Report shows that most of the top-ten countries are relatively small, with Denmark, Switzerland and Iceland in the top-three, and only Canada, Netherlands and Australia (numbers six, seven and nine) having a population above 10 million.

Schermafbeelding 2016-05-22 om 18.37.08

Father state makes you… happy?

There is a second way of looking at the question, though. Does the share that the government takes in the economy and society affect happiness levels? Is it the invasive Big Government or rather the freedom of the laissez faire night-watcher state that makes people best off?

A book by Benjamin Radcliff, The Political Economy of Human Happiness, suggests there are three ways of measuring state size when assessing the correlation: welfare spending; overall government spending; and taxation.

From a theoretic perspective, one could presume a link between government spending and happiness. For instance, welfare policies could be expected to provide the safety net to lower income and/or unemployed people, and therefore reduce inequality. Similarly, a large amount of government spending – for instance by providing free or subsidised education or healthcare – could result in higher happiness levels.

Indeed, the evidence assessed by Radcliff suggests this kind of link. His data shows that for one of the metrics, linked to welfare spending, countries scoring high on this indicator, happiness levels are above one point higher than low-scoring countries. He suggests that this contribution to happiness is double that of being married (being married is positively correlated with happiness), and three times the negative drag of unemployment. To give an example: if your baseline happiness is 7, living in a state with high spending would statistically increase your happiness to 8. Being unemployed would drag it down to 6,7. That’s the magnitude of the influence of the state size according to Radcliff’s evidence!

More tax, more happiness

Government spending doesn’t come for free. While taxation of citizens and companies isn’t the only source of income, it typically is the most significant one. Could it really be the case that being taxed more resulted in citizens being happier?

Again, the data suggest there is a correlation. Radcliff even states that “higher levels of taxation suggest higher levels of satisfaction with life”.

The graph here compares taxation levels (tax revenue as % of GDP) with happiness levels (life satisfaction), based on data from the OECD and the World Happiness Report quoted above. It shows an increasing trendline, associating a level of taxation of 20% in this group of OECD countries with a happiness level of around 6.5. All others thing equal, a level of 50% is correlated with a happiness level of around 6.8: some one thirds of a point higher across the trendline.

But not all others things are equal: the distribution is broad and the effects are very diverse. Denmark is on the top right with a happiness level of 7.526 and the very highest tax level of 50,9. On the far left, we find Switzerland with a marginally lower happiness level of 7.509 and only half the tax rate at 26.6%. On the lowest part of the graph, with happiness levels just above 5 points, we find Portugal, Greece and Hungary, with taxation levels around 34-38%.

tax vs happiness


Correlation, goes the warning to every first-year student, is not causation. The 34 countries of the OECD provide some interesting figures, but there are many other factors than taxation that determine happiness. Idiosyncratic factors and practical things like a state’s efficiency – what kind of society does is create with the 20 or 50% tax money it collects? – certainly also play a role. I’ll look at some of what the states does next week: the Nanny State.

Keynes’ dream: how to get to a 15-hour working week by 2030

For many ages to come the old Adam will be so strong in us that everybody will need to do some work if he is to be contented. We shall do more things for ourselves than is usual with the rich to-day, only too glad to have small duties and tasks and routines. But beyond this, we shall endeavour to spread the bread thin on the butter-to make what work there is still to be done to be as widely shared as possible. Three-hour shifts or a fifteen-hour week may put off the problem for a great while. For three hours a day is quite enough to satisfy the old Adam in most of us!

In his essay on “The Economic Possibilities of Our Grandchildren” from 1930, economist John Maynard Keynes famously predicted that in the future, people would only work fifteen hours a week. In hundred years, he wrote, the standard of life in progressive countries would be four to eight times higher than in 1930. In the extract above, he wrote that  for ‘the old Adam’ in 1930, a fifteen-hour working week would be necessary to fairly divide the available work across the population.

With 14 years to go, there’s still a lot that needs to be changed!

Considering the gap between current working hours of 35 (officially in France), 40 hours for most and 50-60 or more for workaholics, maybe we should strive to reduce our working hours in smaller steps at first?

According to OECD data, the average working hours per year stands at 1770 hours per year across the OECD countries. These are not equally divided through the year (think of Easter, summer, and Christmas breaks): the weekly average is probably around 37 hours. These figures are actually worked hours, per worker, so including part-time workers and seasonal labour.

Against prejudices, the number of hours stands at 42 in Greece; in Germany and the Netherlands, the average is around 30. In the latter two, these figures are skewed by the high proportion of part-time workers, but also can be seen as a sign of high labour productivity! And surprisingly, it’s not Americans or Japanese that put in most hours. Instead, the workaholics of the OECD live in… Mexico. At 2238 hours per year and some 45 per year, the average person’s working week is some 50% longer than in Germany and the Netherlands.

Working hours in euro area and selected third countries. Source: OECD

Working hours in euro area and selected third countries (click to enlarge) Source: OECD


Step 1: down to 30 by 2020

What if we could achieve this level of 30 hours without these tricks? In their history, the Green and Socialist Parties in Sweden have aimed to reduce working hours to 30 per week. Scandinavian countries have a reputation for a healthy work-life balance and indeed are towards the left of the curve. Swedes work a bit more than the French with their 35-hour working week policy.

Last year, a retirement home in Gothenburg started to experiment with a 30-hour working week. Nurses tell researchers they feel they have more energy. The experiment is funded with a subsidy of around 500,000 euros to compensate for the higher number of staff needed to care for the residents.

But other examples cited in another article, such as creative and service industries, suggest that not so much more staff is needed. People still want to do a good job, and may achieve similar levels of productivity in six hours as in eight, says an app developer. With some testing and refinement, wouldn’t we able to get this rolled out by 2020?

Step 2: let’s get down to 21 by 2025

From the perspective of the new economics foundation, a think-tank on “economics as if people and the planet mattered”, getting down to 30 is good, but only halfway there. In a pamphlet and a TEDx talk, researcher Anna Coote argued for a 21-hour working week ambition (she herself, a recovering workaholic, is at 30 hours).

She argues that shorter working weeks would have a range of social and environmental advantages. For instance, it would distribute work more evenly across society, and hence reduce unemployment, and increase our ecological footprint. Now, we are getting close to Keynes’ expectations 85 years back. Doesn’t it sound utopian to work only four/five hours per day, four or five days per week? Or is it really feasible to do this within ten years, coinciding with decarbonisation of the economy and lower energy use to meet the targets of the COP21 climate change agreement?

Step 3: down to 15 by 2030 – or why not limit us to 4 hours?

But for the American dream, 21 hours is not good enough, and we might be able to do better than Keynes’ 15 hours. American dream salesman and self-help author Tim Ferriss wrote a well-known book entitled the ‘Four-Hour Working Week‘. In the book, he explains that for most entrepreneurs, a small amount of clients brings in most of the revenue. As such, by focusing on these, outsourcing all support functions, and living in low-cost countries, Ferriss claims it is possible to only work four hours a week. Whether you take this as a serious career option or too-good-to-be-true, it’s not a model that could apply to society as a whole.

If everybody were to work only four hours, our economic system would come to a stop. But Keynes 15 hours? If we really change our economy’s paradigm, maybe we can get it done by 2030…

Beyond GDP, a long road to travel

Almost fifty year since the famous speech by Robert F. Kennedy, and almost ten years after the start of a thorough debate on ‘beyond GDP’, it’s time to meet the unfilled promise.

On some occasions before, I have written blog posts to encourage EU policy makers and politicians to step up their ambitions and integrate ‘beyond GDP’ indicators in their policies. For instance, see posts on ‘Gross European Happiness‘ or ‘An EU Happiness Manifesto‘, and an essay I wrote for the Next Generation for Europe magazine NGE Magazine 1 (Chapter three, pdf).

And I must say, the topic is on the agenda. I recently had the fortune to attend a European Commission expert conference on ‘beyond GDP’. Noting the importance of the topic, the conference was opened by two outgoing Commissioners: Laszlo Andor, for Social Affairs, and Janez Potocznik, for Environment.

Winning the battle of measurement…

How to make the giant leap from theory to practice? Enrico Giovannini, a former Italian Minister and OECD Chief Statistician, has pushed the debate on GDP forwards in the recent decade. He asked whether those supporting the idea of beyond GDP have won or lost in the debates from the last years. His conclusion was that the ‘battle of measurement’ has been won. In comparison to ten years ago, national statistic offices do a lot more effort to measure what matters.

Routine measurements of social and environmental indicators allows us to get a broader understanding of quality of life than economic growth and inflation could give us. They are more and more interested in collecting and refining social figures on employment rates, NEET rates (people Not in Education, Employment or Training – a proxy for youth employment), and inequality-adjusted GDP growth. Environmental numbers like generated waste, emission of green house gasses and water use also gain more prominence. And new indices like the OECD Better Life Index treat all indicators equally.

OECD

Screenshot of the OECD Better Life Index website

… but the battle for policy must still be fought

There are two questions around this: do we measure enough? And do we do enough to exploit this massive amount of data and adapt our policies to it? When asking whether we won the battle of policy, the answer from Giovannini is simple – no. If you want to make simple policies from these crunched numbers, you have to make trade-offs. How much air pollution is an increase in GDP of 1% worth? How much fossil fuels can you burn to lift one thousand people out of poverty? And what, objectively, is well-being anyway? These are incredibly difficult questions to answer. Economic growth is a lot easier objective. There is no easy way out.

Can economic, environmental and social betterment go hand in hand? The Commission – via its stated objective of smart, sustainable and inclusive growth – thinks so. But MEP Philippe Lamberts doesn’t agree. He believes that in a finite planet, sustainable growth is an inherent paradox. From an environmental perspective, we may need degrowth; but at the same time, that has consequences on employment. And, higher growth is also associated with more money invested in environmental protection.

How do you cut this Gordian knot?

The quest for perfection limits action

Nobody can easily answer these complex these questions. But I can offer my own conclusions:

  1. A lot of laudable work is being done by statisticians and policymakers, especially in social and environmental departments. With a lot of conviction and passion, they had managed to put the issue on the agenda. But they need to get economists more involved in these debate to get more leverage. It was telling that very few participants were trained economists.
  2. Call me a pessimist, but my feeling is that the political momentum behind the beyond GDP drive is fading. There are generic references to the agenda, but the policy efforts needs to be stepped up. In my view, policymakers need to be more courageous and bring their policies to main stream politics. That requires broad political campaigning and communication, as the new economics foundation also writes (pdf). Reports don’t change reality. Action does.
  3. Finally, maybe it is a quest for perfection that is limiting action. A perfect measurement of well-being does not exist. If you group indicators together in one figure – say well-being is ’42’ – you can make little sense of it. Similarly, a ‘dashboard’ with eleven different figure as in the OECD Better Life Index can be difficult to apply. But in this case, it appears the perfect is the enemy of good. GDP also has been refined often. It’s better to refine measures and policies of well-being on the way than to never start the journey.

Beyond GDP: a long road to travel, but one that is worthy to go.

Gross National Happiness – an idea whose time has gone?

In a piece in between a challenge and a provocation, the Financial Times’ Beyond Brics blog this week claimed that “Gross National Happiness is a bad idea whose time has gone”.

Criticising Bhutan is not new. The Himalaya kingdom famously has inspired the concept of Gross National Happiness (GNH) in the 1970s (earlier discussed in several posts). But the country remains poor. Average GDP per capita stood around $7,000 in 2013, below China and Thailand but above India and the Philippines.

Bhutan. Photo via Let's Travel Somewhere.

Bhutan. Photo via Let’s Travel Somewhere.

A young democracy

It is a young democracy. The royal family in 2008 decided to hand over power to the parliament. The elections in 2013 where the second in Bhutan’s history and saw the ruling party hand over power to the opposition. Nevertheless, Bhutan by no means have the democratic culture similar to Western democracies. Like in many Asian countries, Bhutan has a history of serious troubles with minorities. In the 1980s, tens of thousands of ethnic Nepalis have been expelled, suggesting the idea of one harmonious society does not extend to people following other faiths than Buddhism.

Do all these ills discredit Gross National Happiness as a concept to inspire government to bring about higher levels of well-being for the population?

In an interesting statement quoted by the FT, current Prime Minister Tshering Tobgay says:

If the government of the day were to spend a disproportionate amount of time talking about GNH rather than delivering basic services, then it is a distraction. Rather than talking about happiness, we want to work on reducing the obstacles to happiness.”

GNH is a tool

Both FT writer Alan Beattie and from PM Tobgay here blatantly misrepresent what GNH is. GNH is not a religious credo offering answers to all questions. Like GDP, it is a tool that should be used to judge where the government should focus its efforts. Using a broader indicator like GNH can help a state of offer more holistic objectives beyond promoting economic growth. GDP is better suited to factor  in environmental and social criteria.

GNH as a concept is not the problem. It is the lack of a systematic administration that can thoroughly implement the idea. The contradiction between GNH and basic services. If GNH is the focal point, and you ask yourself what you can do to enhance the quality of life of your citizens, the major way you can increase well-being is realise these basic services. Spending a disproportionate amount of time talking about GNH is just as unproductive for a government as spending a disproportionate time of talking about the weather.

The duty of a government is to take care of the population it governs. That means taking care of safety and security, functioning healthcare and education systems, and doing so in a way that ensure well-being and a good life for the future generation. How can people be happy without basic services?

Any index is arbitrary

Gross National Happiness, or alternative indices offering national accounts of well-being, have also been criticised for a lack of transparency. They are not perfect. Indeed, in an autocratic state – of which Bhutan still appears to have some characteristics, there are ways to manipulate the outcomes of an index. But at the same time, GDP or economic indicators are not an exact science. They can be manipulated, albeit with more difficulty. And like GNH, elements included in GDP can be arbitrary or inflated. Should investment in research account as productive, or a cost? Should the shadow economy be included? Is prostitution productive? And what about money spent on jails or rifles, as Robert F. Kennedy asked?

There is one point where I agree with Alan Beattie. He appears to support the OECD’s Better Life Index. Rather than formulating results in one number with little value per se (as GDP and GNH do), the Index offers a comparison between several objectives. This makes it easier to compare performances in different fields, and to assess where performance is lagging and efforts should be focused on.

Where I disagree with Beattie and Togbay is in my belief that GNH, if applied well, is getting closer to the right answer than GDP. Considerations of GNH can set the direction. GNH is not a goal per se, but sets a horizon and offers a sense of direction. Where confronted with various options for government measures to invest in, happiness considerations can guide politicians in prioritising the area where the most impact on well-being can be made. They might sacrifice a couple of percentage points of economic growth, but perform better for social or environmental terms.

The main lesson of Bhutan, in the last decades, is that there is more in life than economic development. By raising his standard against GNH, Beattie risks losing four decades of slow and hard needed progress: social, environmental and economic.

Where the life is good: the OECD’s Regional Well-Being index

[Gross Domestic Product] measures everything in short, except that which makes life worthwhile

Robert F. Kennedy, 1968

The Organization for Economic Cooperation and Development (OECD) has taken Kennedy’s words to heart. Through its Better Life Index, it is conducting an impressive work programme to analyse quality of life in the 34 developed countries that constitute its membership. The OECD index provides a broad overview of quality life, measuring the performance of countries on various important issues, from housing to environment and from civic engagement to life satisfaction. Like  the Gross National Happiness (GNH) concept, the Better Life Index indicates what the good places to live are in a much broader sense than the mere economic data of GDP could do. Wealth’s correlation with happiness is limited at best, scientists have shown time and again.

But there remains a problem with this kind of national indices: they provide national averages – and do not say anything about the extremes and the equality of the data. California differs from Vermont. Sicily is not the same as Südtirol, the German-speaking part of Italy. To take account of regional differences in quality of life, the OECD has now released a similar website on regional well-being.

Some of the observations:

  • The balance varies a lot across regions. In California, income, jobs and education are at higher levels then in Vermont, but for safety and civic engagement the golden state is a lot worse off than Vermont.
  • Brussels is performing a lot worse on jobs (1.5 points out of 10) and environment (1.6) then I would think, but apparently has a high level of civic engagement (8.6).
  • Across the board, Dutch regions reach high scores, except for income and environment. All over the Netherlands, safety and access to services are close to perfect 10s.
  • Südtirol (or province of Bolzano) is indeed a different world from Sicily. The differences are most striking in the rate for jobs (8.8 vs 0.5). Italy’s figures confirm the large divide in incomes between North and South, whilst incomes are most equal in Austria.
  • Czech regions, to my mind, score surprisingly bad in health but almost all have full scores of 10 for education, here defined as the level of people with secondary education or higher.
  • The Mexican region of Jalisco has adopted well-being as a guiding principle in its policies. Still, it has a lot of space for improvement when compared with regions of richer OECD countries. The region already scores well on jobs and environment. And as a survey from a local NGO suggest, the comparable low scores do not mean that people perceive a low level of well-being. According to their figures, 67% in the region feels prosperous.
Picture 1

Brussels Capital Region, the region where I live, scores well on civic engagement and access to services, but has a lot to improve for jobs and environment. Source: OECD

So What?

Lists and rankings have a broader use than providing bloggers something to browse through on a Sunday night. They can bring order to life – be it by classifying which celebrities are hot and which are not lists, listing the best goals of the World Cup so far (no surprise, Flying Dutchman van Persie tops the list), or of countries which provide the most creative ideas (Ireland is first according to TED).

The OECD list, similarly, provides a benchmark of how regions performance. Seeing where you outperform peers or lag behind gives a motivation to improve. The index can help regions to decide where to focus their resources, and thus make better-informed decision how to spend civil servants’ time and money. As our representatives, politicians and administration should learn from these data. The data can help our administration to perform their duty: continuous improvement of our collective well-being.

Examples of well-being projects in some regions are already included on the OECD site.