Tag Archives: Life Satisfaction

How’s life in 2017? Social divisions result in lower happiness, finds OECD

How’s life?

It’s not only mother or your colleague who’s asking from time to time. Policymakers are interested, too.

The Organisation for Economic Cooperation and Development (OECD) every year comes with thick studies to answer the question. Earlier this month, the 2017 edition was published, mapping how people in OECD countries feel about a bunch of things: jobs, health, safety, life satisfaction, and so on. Altogether, the datasets cover eleven broad indicators of the OECD Better Life Index.

These studies are important. Data is power, and having information on how people feel matters a great deal to making the world a better place. As the OECD says it: it helps achieving well-being for all.

So, how do we feel?

The answer is 6.5.

That is, on a ten-point scale, is the average life satisfaction for 2017, marginally lower than the 6.7 score shown in 2005. The small decline probably results of the interaction of a few steps forward and a few step backwards. For instance:

    • Incomes and earnings went up, by 8% and 7% respectively. But inequality remains strong: 1/3 of people would go in poverty if they had to miss three months of salary.
    • The employment rate went up by 1.3 percentage points, and working hours improved in most countries. But long-term unemployment got worse in half of the countries.
    • Since 2005, the number of smokers reduced from 22% to 18%. But the number of obese people increased from 22% to 24%.
    • Education levels see strong improvements. But voter turnout and trust in government decline in more than half the countries.

Well-being for all

A large part of the 2017 report is dedicated to equality. While debates about inequality are often about wealth and income, the OECD believes that inequality is felt in every area of our lives.

For instance, the richest 20% are advantaged in many well-being indicators:

  • Rich people spent 11 times more time on social activities than poor people
  • The top-20% has 5-fold higher household income than the bottom-20%
  • Life satisfaction is twice as high
  • And poorer people tend die a lot younger: the standard deviation in age at death is 13 years

And as a special section of the report shows, migrants particularly tend to be worse off.

This all matters, because more equal societies tend to be happier ones. While the situation is a bit scattered, there is some correlation between income equality and life satisfaction. In OECD data, the correlation is even stronger when inequality is plotted against the broad well-being indicators.

The American Dream vs Janteloven

Take the examples of the United States and Denmark. If you are successful in life, you can have all the American dream. The US is a ‘winners’ society: it is an extremely rewarding environment to build a business and prove yourself. Income taxes are low, and healthcare and social security provisions are bare. At the level of society, the payoff in happiness is not too high. America ranks 14th in the World Happiness Report, with an average below 7 out of 10. Not that great, one might say.

Denmark, to the contrary, is a society that also wants to make ‘losers’ thrive. It offers a strong social security system, that’s even a factor contributing to high happiness. Denmark also wants to offer a good life to people that ‘fail’ in life. Indicative for the Danish way of looking at success is the ‘Janteloven’, or Law of Jante. Janteloven is a list of ten rules that basically boil down to: don’t imagine you’re someone, we’re all the same, and you’re not worth anything. Though, depressingly, the sense of equality it instills helps contributing to a balanced, and happy, society. Denmark often ranks on top of the happiness list, finding itself back at 2 in 2017.

Data to learn from

Either way, Americans and Denmark are both as they are. Even cultural differences in our thinking about inequality could affect our happiness. Beyond books and articles about hygge, reports like the OECD one help to learn from each other. It feels naive to write this down, but the United States can become a little bit more like Denmark. And among the wealth of data, Denmark can also find some inspiration in how people in the US pursue happiness.

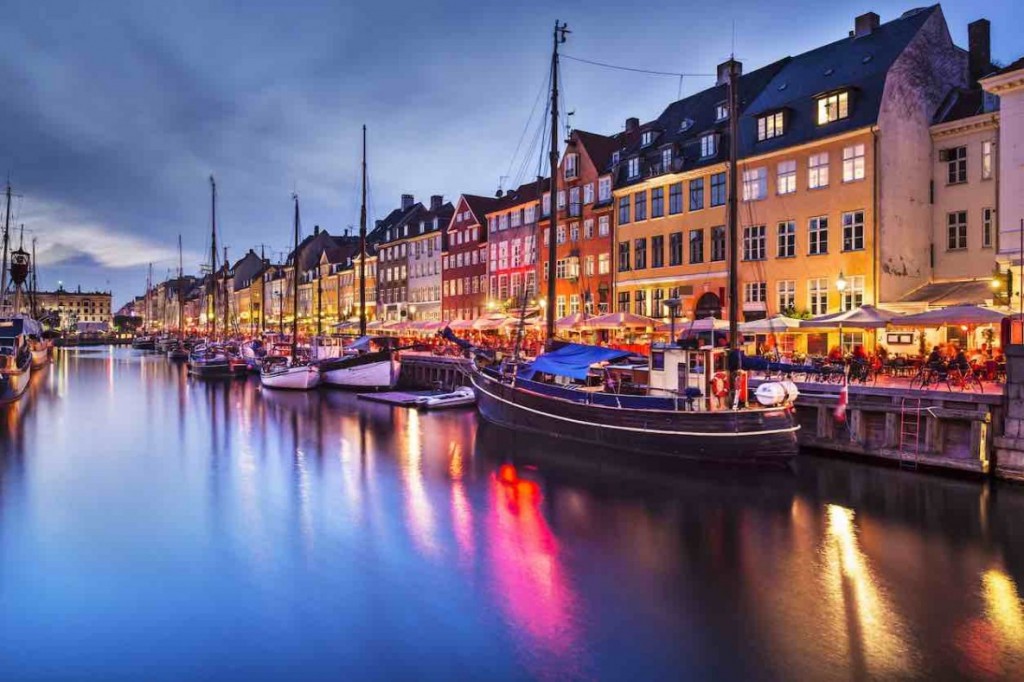
View of Nyhavn, Copenhagen.

View of Nyhavn, Copenhagen.

How happy are we actually in Europe?

Did you feel particularly good last Friday? Maybe you enjoyed #Eclipse2015 as so many others did. Or you felt great because the world was celebrating the International Day of Happiness!

The International Day of Happiness was instituted by the United Nations in 2012, as I wrote last year. I must say that beyond a flood of tweets, I haven’t seen too many official events this year. The exception however was a very interesting data set from Eurostat that answers how happy we actually are in the EU.

I’ll come with the answers soon. But let me first give an idea on how we actually measure happiness.

How do you measure happiness?

There are practically three ways to measure happiness:

  • “Overall, how satisfied are you with your life these days?” With this question, people are asked about their overall quality of life or life satisfaction. There can be a little bias there – I might answer something different today than I would tomorrow. But the experience of researchers is that these biases cancel each other when the sample is large enough.
  • “How much of the time over the past four weeks have you been happy?” This question instead measures positive affect, or people’s happiness level on an emotional rather than on a more rational level. It’s based on the idea that beyond the overall life satisfaction, the presence of positive emotions and the absence of negative emotions is a good indicator of how a person really lives. 
  • Finally, there is ‘eudaimonia’, ‘eudaimonic happiness‘, or ‘meaning of life‘, which has a less clear-cut question. Eudaimonia broadly refers to the value and purpose of life, important life goals, and for some, spirituality. This requires a bit more reflection before it is answered.

Eurostat’s results show that the three measures are correlated at country level and at individual level, with some exceptions. A high level of positive affect is correlated with high life satisfaction and meaning of life. Still, one out of fourteen is ‘happy all of the time’ but with a low level of life satisfaction!

The good news: how happy are we?

There is a lot of good news in the figures:

  • 16 out of 28 countries have an average above 7.0, and the EU average is 7.1 out of 10
  • The highest level of happiness is found in Denmark, Finland and Sweden, with 8.0. The Netherlands and Austria score an 8.
  • On average, young people (16-24) score highest, at 7.6. The outliers are the Austrians: 8.4!
  • In Finland (8.3) and in my own home country, the Netherlands (8.0), the highest bracket is the age group 25-34. Does that mean that statistically, I will never be as happy as I am now? (The answer is: no. The study explains there can also be a ‘cohort effect’ – a group of people could retain the same happiness level, independent of their age group.
  • And the happiest are… Danish seniors! The absolute highest number is found in Danes in the age of 65-74: 8.6, and 0.7 higher than the 50-64 group in Denmark (7.9). There must be something amazing about retirement in Denmark!
  • There is only a marginal difference between men (7.1) and women (7.0). Also, there are slightly more women in the highest category. And controlling for differences in income, marital status, and labour market position, women are happier.
  • 42.1% of Danes scores above 8, and only 5.6% of Dutch score below 6. This might actually be the most important outcome: when it’s about happiness, it is not only the average but also the distribution that should count. In these two countries, happiness seems to be distributed fairly equally.

The bad news: how unhappy are we?

But there also is a bit of bad news in the figures:

  • Generally, happiness levels tend to decline with age: from 7.6 (16-24) to 6.9 (50-64), before making a little rise to 7.0 (65-74) and a further decline to 6.8 (75+)
  • Bulgarians and Serbians appear to be quite miserable: they score averages of 4.8 and 4.9. In Bulgaria, every age group is below 6.
  • Unemployment buys unhappiness. The difference between full-time employment and unemployment is 1.6 points (7.4 vs 5.8).
  • There is also a strong relation between poverty and unhappiness. Only 7.5% of materially deprived people has a high level of life satisfaction. And deprivation of important needs (ability to pay rent, to keep the home warm, a holiday or a car) has a larger negative effect on happiness than poverty in monetary terms.

The full analysis from Eurostat is available here.

Picture 3

The optimal income for happiness

What is the optimal income for happiness? How much happier are people with a large bank account than those who suffer through the last days of each month? Scientists have done a lot of effort to investigate the relation between money and happiness.

The conventional wisdom in happiness economics states that, indeed, happiness levels rise with income, to a certain point. After this point, the impact on happiness of an additional euro, pound are dollar is virtually zero: more money does not mean more happiness. But is it possible to exactly measure the cut-off point? That is, can we measure what the ideal income is, generating the best happiness bang for the buck?

Eugenio Proto of Warwick University and Aldo Rustichini of the University of Minnesota claim to have the answer. Their research attests that life satisfactions reaches its maximum level at an income level of $30,000, or about the level of Equatorial Guinea using World Bank data (though French people aren’t necessarily the happiest ones).

But Proto and Rustichini’s research reveals there is even more: after this point, people even become less happy. They  explain that this effect arises due to changes in what they label the ‘aspiration level’ of people with a below average income in rich countries.

Simply speaking, when incomes rise, the gap between the have-lots and have-less become bigger. When surrounded by wealthier people, people have higher aspirations for their own life, often irrationally> as the gap between reality and dreams increase, life satisfaction diminishes.

Their data set out the income level versus the likeliness of reporting the highest level of happiness. People in a country with an income per head of $5,600 are 12% less likely to report the maximum number than in a country with an income of $15,000. As incomes rise, the effect disappears. And after $30,000, the link even becomes negative.

What does this mean? Of course, you may consider moving to Equatorial Guinea if you live in a richer country but make less than the holy number of $30,000. Jokes aside, there is more  at stake here. Higher incomes aren’t necessarily a sign of progress. They might be caused by longer working hours, more overtime and less time for leisure, all factors that bring down happiness.

But maybe the real effect displayed by the study is the cost of inequality. Earlier studies have shown that it is not only the absolute figure of income that determines your happiness. It is also about your income relative to what you could make. If you make less than your friends, your colleagues, or than your did in a previous job, this might cause total misery. The moral of the story is simple: if countries care about our quality of life, they should seek to control income inequality. Equal countries, like Denmark, Norway and Sweden are all in the top-five of happiest nations. At least, their high government spending seem to be good for something. Money can’t buy you happiness, the adagium goes, but maybe their high taxes do?