How’s life?
It’s not only mother or your colleague who’s asking from time to time. Policymakers are interested, too.
The Organisation for Economic Cooperation and Development (OECD) every year comes with thick studies to answer the question. Earlier this month, the 2017 edition was published, mapping how people in OECD countries feel about a bunch of things: jobs, health, safety, life satisfaction, and so on. Altogether, the datasets cover eleven broad indicators of the OECD Better Life Index.
These studies are important. Data is power, and having information on how people feel matters a great deal to making the world a better place. As the OECD says it: it helps achieving well-being for all.
So, how do we feel?
The answer is 6.5.
That is, on a ten-point scale, is the average life satisfaction for 2017, marginally lower than the 6.7 score shown in 2005. The small decline probably results of the interaction of a few steps forward and a few step backwards. For instance:
- Incomes and earnings went up, by 8% and 7% respectively. But inequality remains strong: 1/3 of people would go in poverty if they had to miss three months of salary.
- The employment rate went up by 1.3 percentage points, and working hours improved in most countries. But long-term unemployment got worse in half of the countries.
- Since 2005, the number of smokers reduced from 22% to 18%. But the number of obese people increased from 22% to 24%.
- Education levels see strong improvements. But voter turnout and trust in government decline in more than half the countries.
Well-being for all
A large part of the 2017 report is dedicated to equality. While debates about inequality are often about wealth and income, the OECD believes that inequality is felt in every area of our lives.
For instance, the richest 20% are advantaged in many well-being indicators:
- Rich people spent 11 times more time on social activities than poor people
- The top-20% has 5-fold higher household income than the bottom-20%
- Life satisfaction is twice as high
- And poorer people tend die a lot younger: the standard deviation in age at death is 13 years
And as a special section of the report shows, migrants particularly tend to be worse off.
This all matters, because more equal societies tend to be happier ones. While the situation is a bit scattered, there is some correlation between income equality and life satisfaction. In OECD data, the correlation is even stronger when inequality is plotted against the broad well-being indicators.
The American Dream vs Janteloven
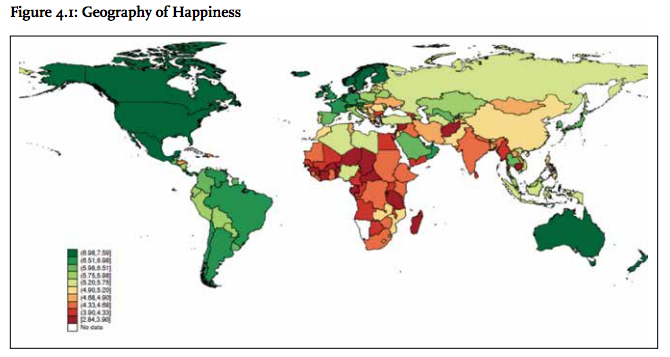
Take the examples of the United States and Denmark. If you are successful in life, you can have all the American dream. The US is a ‘winners’ society: it is an extremely rewarding environment to build a business and prove yourself. Income taxes are low, and healthcare and social security provisions are bare. At the level of society, the payoff in happiness is not too high. America ranks 14th in the World Happiness Report, with an average below 7 out of 10. Not that great, one might say.
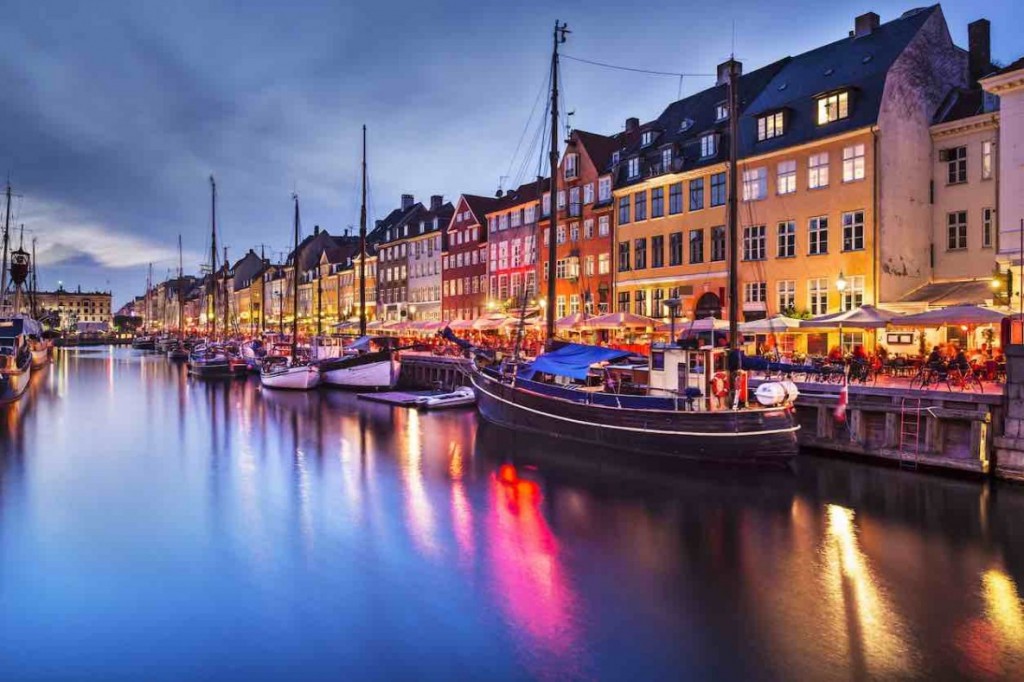
Denmark, to the contrary, is a society that also wants to make ‘losers’ thrive. It offers a strong social security system, that’s even a factor contributing to high happiness. Denmark also wants to offer a good life to people that ‘fail’ in life. Indicative for the Danish way of looking at success is the ‘Janteloven’, or Law of Jante. Janteloven is a list of ten rules that basically boil down to: don’t imagine you’re someone, we’re all the same, and you’re not worth anything. Though, depressingly, the sense of equality it instills helps contributing to a balanced, and happy, society. Denmark often ranks on top of the happiness list, finding itself back at 2 in 2017.
Data to learn from
Either way, Americans and Denmark are both as they are. Even cultural differences in our thinking about inequality could affect our happiness. Beyond books and articles about hygge, reports like the OECD one help to learn from each other. It feels naive to write this down, but the United States can become a little bit more like Denmark. And among the wealth of data, Denmark can also find some inspiration in how people in the US pursue happiness.


