Tag Archives: Netherlands

Netherlands: wellbeing is more than wealth, new indicator shows

One of the Dutch traditions in May is ‘Woensdag Gehaktdag’ (a term so nice I won’t translate it). Every year, on the third Wednesday of May, the government justifies how it has implemented the budget in the last year, and the day the opposition fiercely criticises any misallocated cents.

Last week, however, Woensdag Gehaktdag saw an innovation: it saw the presentation of the first annual Monitor Broad Wellbeing. As I wrote before, this new indicator has been instigated by a parliamentary committee requesting a better toolset to evaluate how the Netherlands is doing in a broader sense than only economic indicators. Prepared by the statistics agency in cooperation with the planning agencies (for which my home country has a passion), the Monitor evaluates quality of life in three ways:

  • wellbeing here and now (how are we doing in the Netherlands, today)
  • wellbeing later (how do our choices today affect the future population of the Netherlands)
  • wellbeing elsewhere (how do our choices affect wellbeing elsewhere)

Throw in a mix of economic, social, environmental, trade and a few extra indicators, and you get a detailed picture of what wellbeing looks like. Where data is available, the Dutch performance is also compared with other EU countries.

A high quality of life, but…

So, how is our broad wellbeing? The conclusions of the report are as follows:

  • Overall, the Netherlands has a high level of quality of life. Many indicators show a positive trend over the last eight years, or a positive change with the year before. Only three out of 21 indicators were markedly negative: the number of people with obesity, satisfaction with free time, and size of nature areas.
  • Nonetheless, the figures aren’t equal. Some groups report lower scores: women, some ago groups (below 25 and 55-65), those with low education levels, and migrants.
  • Here’s the crux: wellbeing scores are clearly higher in the here and now then they are in the future and for the impact on elsewhere. Indicators concerning the future that post lower scores are primarily the environmental ones: CO2 and nitrogen emissions, fossil energy reserves, and biodiversity. Possibly, policy changes may see improvement here in the future, as energy is becoming cleaner and the Netherlands is due to stop all domestic gas production. However, the Netherlands large agro-food business has a massive and unsustainable footprint. You don’t directly see these negative externalities in simple indicators like GDP – a clear example of the value of the Monitor.
  • Another tricky piece is that current wellbeing is also connected with a negative impact in third countries. The Netherlands has a large carbon footprint and imports resources and biomass from elsewhere, including from least developed countries (LDCs). That means that natural capital is moved from those countries.
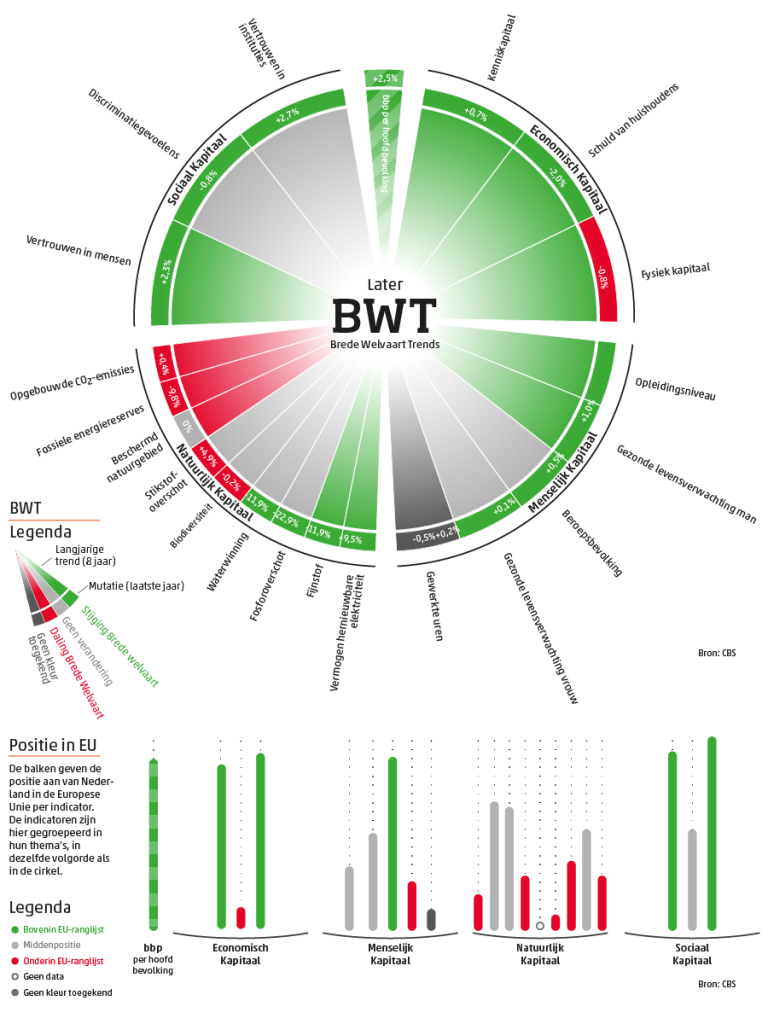
Broad Wellbeing Monitor, 'Later'. Source: Dutch Statistics Agency

Broad Wellbeing Monitor, ‘Later’. Source: Dutch Statistics Agency. Key: the graph evaluates the impact on wellbeing later across four categories: economic, human, natural, and social capital. Green/red represents positive/negative 8-year trends or 1-year net changes. The lower part of the graph shows how the Netherlands stand compared to fellow EU countries.

Back to politics

The report is a new annual feature, and should become a high-profile publication with an impact on policy formulation. For that, we go back from the statistics agency to politics, to the MPs and the cabinet we have mandated to make choices for us. This Wednesday will see the Parliament evaluate the government’s performance in a plenary debate, and MPs can use findings of the report to encourage the government to reshape their priorities. In this way, they can make the Netherlands a happier place, not only now, but also later and elsewhere.

 

Who do I vote for happiness?

Tomorrow my home country, the Netherlands, goes to the polls. The Dutch political system has a low barrier to enter the parliament. Especially this year, this leads to a proliferation of parties: there are 28 parties on the ballot, of which around 11 to 15 stand a stance to win seats according to recent polls.

The broad offer of political ideas also resulted in a large amount of online voting tools. Nowadays, about fifty sites offer tools to compare your views with party manifestoes. Apart from two big and generic ones, others help you to determine which party to vote if you are an entrepreneur, a young voter, if you want to see swift work on climate change, and even if you smoke cannabis (this remains the Netherlands…!).


A voting tool for happiness

But there is no tool on happiness. If I want to support a politician that promotes policies improving happiness and well-being, who should I vote? Does any politician ‘run on happiness’?

Happiness is a very tricky issue for politicians. Few politicians would directly promise to make their voters happy, and for good reasons. But if you dig a bit into some of the electoral manifestoes, a couple of ideas linked to wellbeing and the beyond GDP agenda do appear.


Four out of the seven large parties have some notion of happiness

Let’s run through the seven parties performing best in the polls; known as VVD, PVV, CDA, D66, GroenLinks, SP and PvdA in their Dutch acronyms.

Three of the main parties do not dedicate a single word to these ideas. For the one-page manifesto of the Freedom Party (PVV, Geert Wilders), this is not a surprise. It’s main aim is to ban things that does not make its leader happy: islamic, asylum seekers, the koran, and public expenditure on culture, wind mills, public broadcasters, etc.

For the Christian Democrats (CDA) and especially Labour (PvdA), I am a bit surprised not see a reference. Both have paragraphs on sustainable economic development, and the link to welfare and wellbeing could be easily made there.

The idea of basic income – arguably also a revision to the thinking about wellbeing – appears in some manifestoes. Some smaller parties wholeheartedly support it (including a dedicated basic income party), while Labour, Greens and Social Liberals (D66) favour experiments with this tool.


Liberals: we are happy already, nothing to do here

The Liberals (VVD) programme follows Prime Minister Rutte’s relentless optimism: if the Netherlands wouldn’t exist, we would invent it. We’re one of the happiest countries of the world. Almost nowhere else life is as good as here (the Netherlands second?). But the measures it then proposes do not concern happiness or wellbeing – the programme simply focuses on prosperity. Is our happiness then just a coincidence? If our basis is so strong, isn’t there any way to strengthen wellbeing even further?


Socialists: equality makes everybody happy

The Socialists (SP) start from the correct notion that people are happier in a country with smaller differences between people, and equality is a key objective of their policies. Elsewhere, the programme notes that there is more than GDP, and wellbeing and sustainability should be considered to measure prosperity. Surprisingly, this point does not lead to a plea for alternative indicators. Instead, the relevant paragraph continues to speak out against European budget rules…


Greens: GDP is not holy

The Greens include a section on a pleasant life, with mostly has to do with nature and spatial planning. Quality of life in our neighbourhoods should be improved, and with an allusion to Robert F. Kennedy, the programme states that “the value of the beauty of the landscape, nature and animal welfare cannot be expressed in money”.

Elsewhere, the manifesto states that ‘GDP is not holy’, and that “wellbeing is a lot broader: green growth with sustainable boundaries, based on knowledge and innovation; inclusive growth, that creates good jobs and fair incomes. That is what counts.” A couple of nice quotations, surely, and the manifesto is full of utopian ideas to get to such a society. Indeed, according to the Central Planning Agency that reviewed the impact of most parties’ programmes, the Greens gets us very far in reducing income differences. Revision in the taxation system should finance this: the Greens are the most radical in greening the taxation system via the ‘the polluter pays’ principle.


Social Liberals: measure wellbeing

The Social Liberals (D66) denounce both the dogma of a government that steps too far back and the dogma of the state as a ‘happiness machine’. The programme notes that employment and social expression contribute to people’s happiness. The party also has the most detailed view on measuring wellbeing. In a dedicated paragraph, the party states that we should not only measure GDP, but also evaluate our ecological footprint, welfare, and wellbeing. These elements should be evaluated to determine our success. And based on an amendment proposed by your happiness blogger, the programme also links this to the efforts ongoing on the Netherlands to develop an alternative indicator in the form of a ‘Broad Wellbeing Monitor’.


NL happy

The Netherlands’ first step to a happiness machine

In the three years I’ve been writing this blog, I’ve travelled around the world to explore happiness: from Denmark to Mexico and Bhutan, and from Costa Rica to the United States (well, the latter two only in spirit). But so far, I never wrote about my own home country, the Netherlands.

That’s not because there is no interesting debate on happiness in the Netherlands. The Netherlands always scores high in the international rankings (seventh in this year’s World Happiness Report, and fifth last year). It is home to the first Happiness Professor, Ruut Veenhoven. He was one of the first academics to seriously study happiness and his university hosts the World Database of Happiness (I’ve been told their team has identified 963 ways that have been used to measure happiness). A Unicef report often quoted in press demonstrates that Dutch children are the happiest ones of the (rich and developed) world. And beyond that, I’ve come across a lot of great projects on happiness, from happiness budgets for socially deprived people to happiness trainers and from happiness in civil community work to activists for environmentally sustainable happiness. The Dutch appear to be a happy few!

Happy people, happy state?

But does all this manifested interest mean in academia and society mean that also the national government is interested in understanding and enhancing the happiness level of its population? That is not the case. Prime Minister Mark Rutte famously stated that:

The State is not a happiness machine

What does Rutte mean by this? From the 1960s to the 1980s or even longer, many  in the Dutch political elite believed in the idea of socially engineered society, or in Dutch, the ‘maakbare samenleving’ (‘society that can be made’). This idea presupposed that government intervention could achieve a lot to improve people’s lives, the quality of society, and happiness levels. Over time, in the Netherlands like elsewhere the mood has shifted to a society where people are responsible for their own lives and the state does not interfere with people’s personal sphere. Happiness, or quality of life, is seen as a purely personal issue.

In my view, that is too simplistic. In the Netherlands like in Denmark, it just appears that we are getting many factors right. Neither Denmark nor the Netherlands has comprehensive happiness policies, but in both countries the quality of education, healthcare, social security, and trust are amongst the highest of the world. That is something to cherish, but rather than an endpoint, it should be something to build on.

Happiness through reports (or biscuits!)

Instead of developing a vision and a framework on quality of life – such as in Bhutan’s Gross National Happiness, but also in the UK’s government’s programme to measure well-being, the Netherlands has resorted to another strategy: happiness by reports!

It isn’t the only one to do so. The French Sarkozy government commissioned the appraised but never implemented 292-page report on the measurement of economic performance and social progress. The German Parliament outdid the French Committee: it published its own report of no less than 844 (!) pages on Growth, Wellbeing and Quality of Life).

Dutch 'stroopwafels' biscuits, a way to happiness? I'd probably subscribe to that view. Source: image found on Pinterest

Dutch ‘stroopwafels’ biscuits, a way to happiness? I’d probably subscribe to that view. Source: image found on Pinterest

The Dutch Committee ‘Broad Concept of Progress’

The Dutch response came this year. In April, a Parliament Committee published its own report ‘Broad Concept of Progress‘ (Breed Welvaartsbegrip), which it managed to keep just below 100 pages. The Committee set out in an exercise with three aims: to determine what GDP measures and doesn’t measure, whether there is value in broader concepts of progress, and to propose what these concepts should look like.

The Committee does see value in using broader concepts, and evaluates international efforts, like the OECD’s Better Life Index, the EU’s Beyond GDP agenda, or statisticians’ guidance aiming to measure subjective well-being in a more harmonised way. At the same time, it acknowledges the efforts are still very divergent. The report also points the work in the Netherlands itself via the Monitor Sustainable Netherlands (Monitor Duurzaam Nederland) prepared by the Dutch Statistical Office and three advisory bodies.

Monitor wellbeing broadly

Ultimately, the Committee does not make a clear choice in answering the question how progress should be measures. Instead, it comes with three recommendations. Firstly, to broaden the Monitor Sustainable Netherlands to turn it inot a Monitor Broad Wellbeing, and provide annual updates of the level of general wellbeing in the Netherlands. Secondly, these annual reports shouldn’t end up in a drawer or the fireplace, but be debated with the government in a parliamentary debate. And finally, the Dutch government is called to contribute to the convergence of all various international efforts in wellbeing indicators.

The report doesn’t contain a great ambitious vision, but aims to set a pragmatic and practical agenda. In a debate with MPs today, the Committee seemed to have support for this approach. Hopefully, the Netherlands is making a good choice today. There’s merit in not entering too deeply into the ideological discussions on metrics, as these often arise in arguments of the kind of ‘my index is better than yours’. Instead, by putting the issue on the agenda annually and contributing to find an end in the international labyrinths, the Netherlands may slowly edge closer to develop a vision on happiness.

A trip of one thousands miles to happiness starts with the first step. Even if the Dutch state won’t be a happiness machine anytime soon, it has started a journey.


The Nanny State: repression of happiness?

It’s a pedagogic dilemma all parents will face: should we be strict to our children and prohibit them to do things that are bad for them? Or should we give them the freedom to learn for themselves that sand is not tasty, that you can fall if you climb a tree and that a drink too many has dire consequences the next day?

At the state level, similar dilemmas arise. Social-democrats traditionally don’t scare away from a dose of paternalism to educate citizens. Libertarians, on the other hand, abhor states that coerce a certain type of behaviour. Which recipe works best to develop a happy society?

Two weeks ago, I addressed the question “does size matter” – when it’s about the size of the state and happiness levels, that is. The evidence indicated that some of the happiest states are smaller countries, and that after a certain level? There is – surprisingly – a positive correlation between higher tax and higher life satisfaction. Does that also mean that a more active government, a Nanny State, could contribute to higher levels of happiness?

Nanny State Index

Republicans in the US and liberals in EU States – such as Dutch PM Rutte – agree on one thing: big government is big enough, and the state shouldn’t interfere too much with individuals’ life. That’s also the thought behind the Nanny State Index. It has been developed by liberal or libertarian think-tanks, and maps the strictness of regulation affecting personal choice in the 28 countries of the EU.

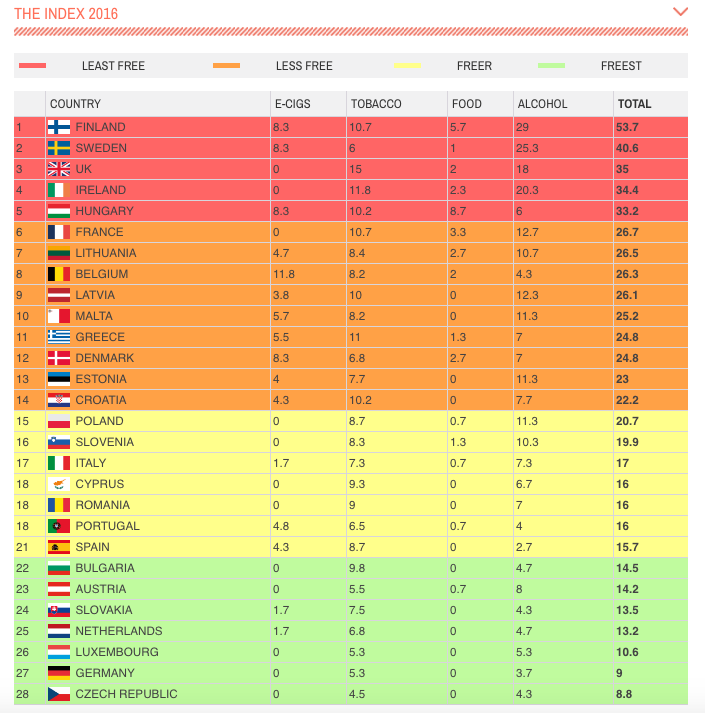
The Index lists four areas: e-cigarettes, tobacco, alcohol, and food. There is quite a difference in the freedom of access to this products across the EU. For instance, in Sweden alcohol is only available in state stores and e-cigarettes are effectively prohibited in Belgium.

Altogether, two of the paternalistic Nordics, Finland and Sweden, top the list. They stay ahead of UK and Ireland. As a result of strict rules on tobacco and so-called ‘sin taxes’ on unhealthy foods and drinks, Hungary completes the top-5. Denmark, which one might expect to be in sync with paternalist Nordics, only ranks 12th. On the lower end of the scale, we find Netherlands, Luxembourg, and Germany. The freest country of all is… the Czech Republic.

Nanny State Index. Source: www.nannystateindex.org

Nanny State Index. Source: www.nannystateindex.org


Does repression, or freedom, bring happiness?

Is there any correlation visible between being a nanny and low and high happiness levels? The evidence is difficult to interpret: the three top-1o countries of the World Happiness Report rank at different places in the Nanny State Index. Swedish is on top of the list, the Netherlands at the bottom, and to confuse the picture further, Denmark is mid-way in the table.

The implication might be the following. Policies may work out differently in different settings. It’s probably the same with children: all are different. Some kids will exploit freedom and end up in troubles; other will feel their confidence strengthened and will be good and happy citizens.

Where the life is good: the OECD’s Regional Well-Being index

[Gross Domestic Product] measures everything in short, except that which makes life worthwhile

Robert F. Kennedy, 1968

The Organization for Economic Cooperation and Development (OECD) has taken Kennedy’s words to heart. Through its Better Life Index, it is conducting an impressive work programme to analyse quality of life in the 34 developed countries that constitute its membership. The OECD index provides a broad overview of quality life, measuring the performance of countries on various important issues, from housing to environment and from civic engagement to life satisfaction. Like  the Gross National Happiness (GNH) concept, the Better Life Index indicates what the good places to live are in a much broader sense than the mere economic data of GDP could do. Wealth’s correlation with happiness is limited at best, scientists have shown time and again.

But there remains a problem with this kind of national indices: they provide national averages – and do not say anything about the extremes and the equality of the data. California differs from Vermont. Sicily is not the same as Südtirol, the German-speaking part of Italy. To take account of regional differences in quality of life, the OECD has now released a similar website on regional well-being.

Some of the observations:

  • The balance varies a lot across regions. In California, income, jobs and education are at higher levels then in Vermont, but for safety and civic engagement the golden state is a lot worse off than Vermont.
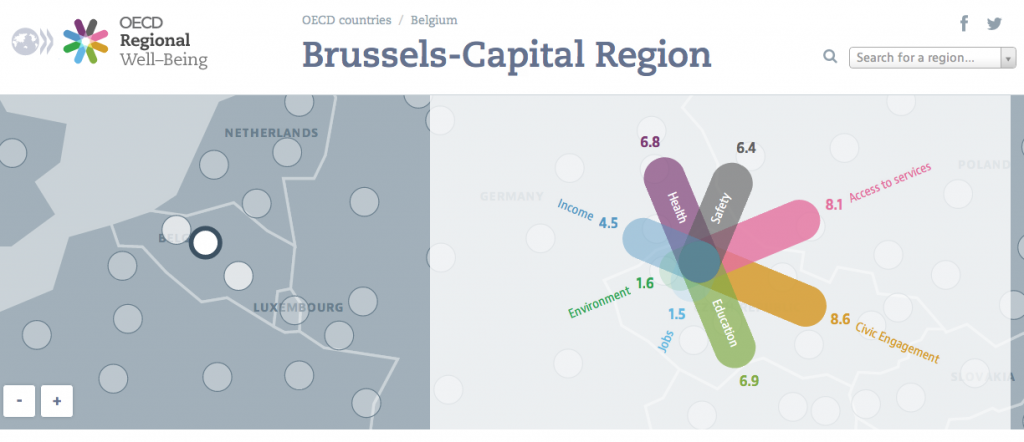
  • Brussels is performing a lot worse on jobs (1.5 points out of 10) and environment (1.6) then I would think, but apparently has a high level of civic engagement (8.6).
  • Across the board, Dutch regions reach high scores, except for income and environment. All over the Netherlands, safety and access to services are close to perfect 10s.
  • Südtirol (or province of Bolzano) is indeed a different world from Sicily. The differences are most striking in the rate for jobs (8.8 vs 0.5). Italy’s figures confirm the large divide in incomes between North and South, whilst incomes are most equal in Austria.
  • Czech regions, to my mind, score surprisingly bad in health but almost all have full scores of 10 for education, here defined as the level of people with secondary education or higher.
  • The Mexican region of Jalisco has adopted well-being as a guiding principle in its policies. Still, it has a lot of space for improvement when compared with regions of richer OECD countries. The region already scores well on jobs and environment. And as a survey from a local NGO suggest, the comparable low scores do not mean that people perceive a low level of well-being. According to their figures, 67% in the region feels prosperous.
Picture 1

Brussels Capital Region, the region where I live, scores well on civic engagement and access to services, but has a lot to improve for jobs and environment. Source: OECD

So What?

Lists and rankings have a broader use than providing bloggers something to browse through on a Sunday night. They can bring order to life – be it by classifying which celebrities are hot and which are not lists, listing the best goals of the World Cup so far (no surprise, Flying Dutchman van Persie tops the list), or of countries which provide the most creative ideas (Ireland is first according to TED).

The OECD list, similarly, provides a benchmark of how regions performance. Seeing where you outperform peers or lag behind gives a motivation to improve. The index can help regions to decide where to focus their resources, and thus make better-informed decision how to spend civil servants’ time and money. As our representatives, politicians and administration should learn from these data. The data can help our administration to perform their duty: continuous improvement of our collective well-being.

Examples of well-being projects in some regions are already included on the OECD site.