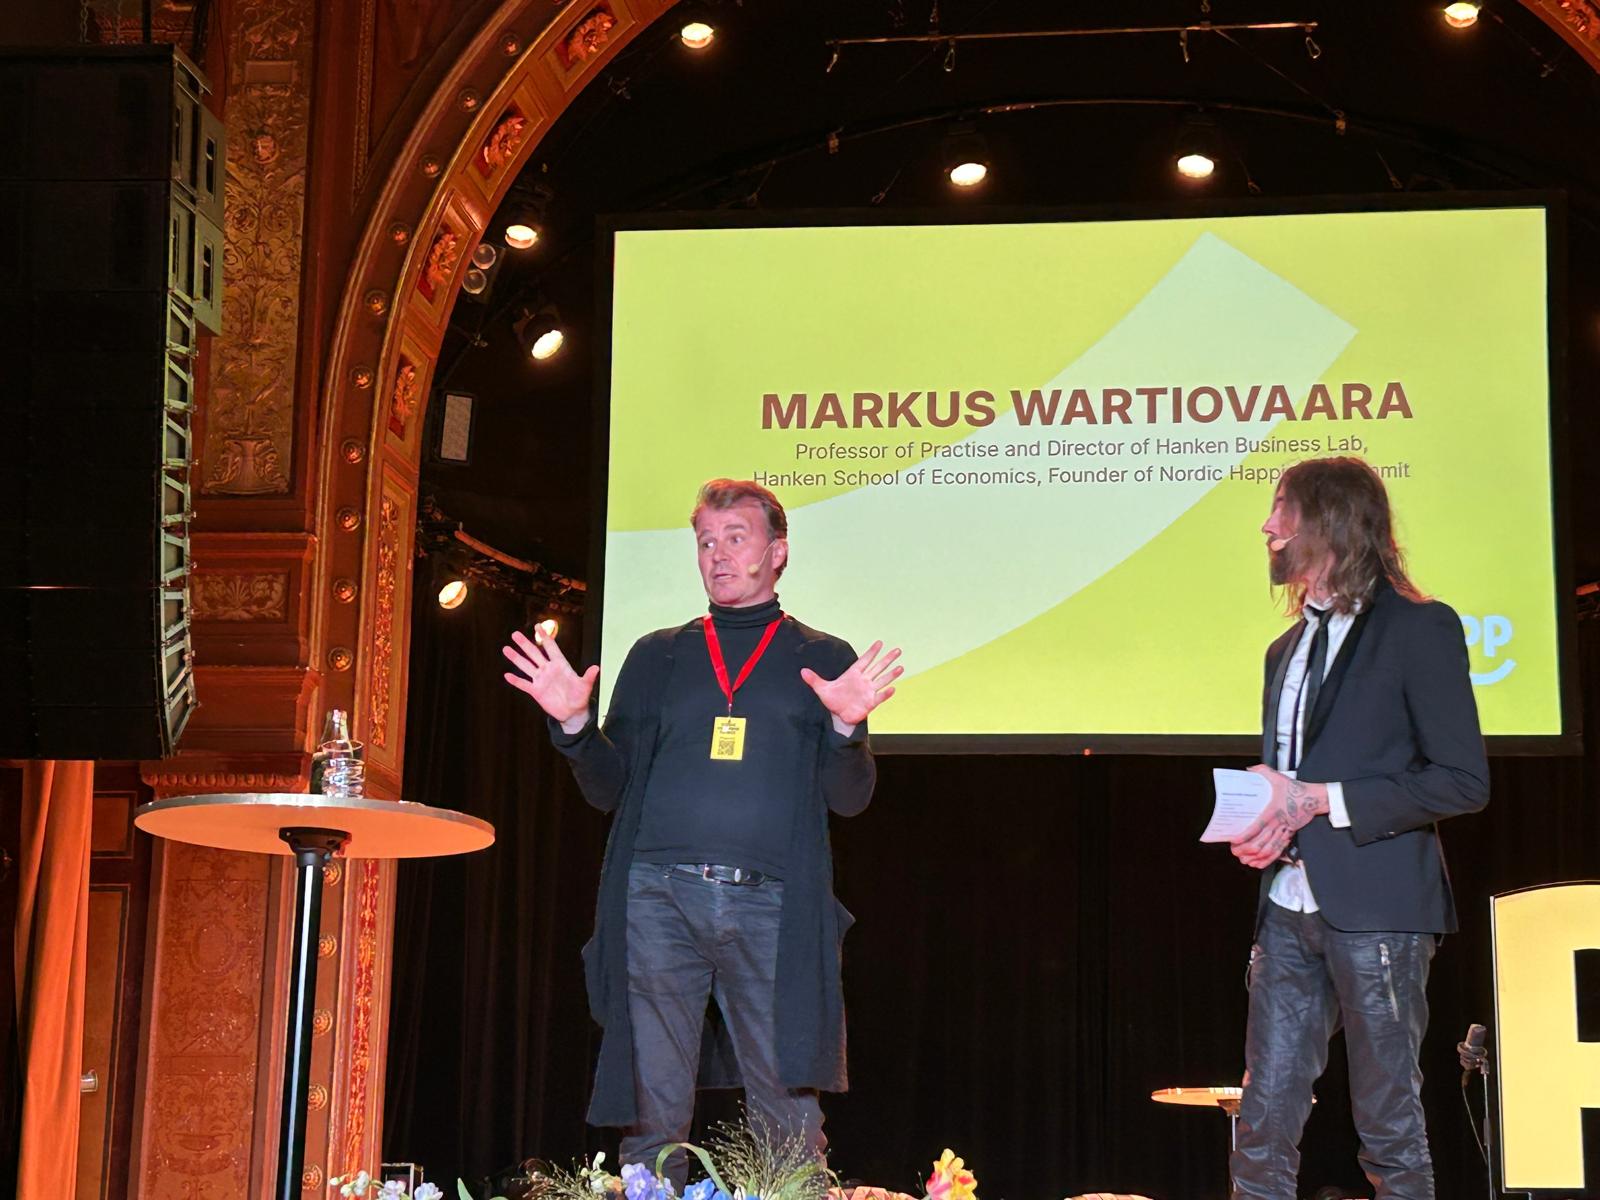
Last week I joined the Nordic Happiness Summit in Stockholm, surrounded by my favourite type of academics: happiness scientists. A group of people that enjoys sharing their wisdom about life’s most important skill (as I see it), and is fun to hang out with. The setting was beautiful too: Stockholm is a lively city, surrounded by water and parks. And our gala dinner was in the city hall, the same place as where the Nobel Prize ceremony is taken place. As an amateur happiness scientist, I fear I won’t get any closer to a Nobel Prize….
Let me share three quotes that struck me.
We are ‘homo sociabilis’.
Norwegian researcher Ragnhild Bang Nes told us there are many studies on the importance of socializing for happiness. We are social animals, and social connection is not a luxury. It made me realise that friendship requires the same attention as maintaining physical health or a good marriage. Research shows loneliness is a strong predictor of unhappiness.
Turn routine into ritual.
UCLA professor Cassie Mogilner Holmes put the idea that happiness requires agency in very nice words. By turning ‘routine into ritual’, simple time nicely spent, such as a weekly ‘coffee date’, gains in meaning. Happy moments are not always about big, extraordinary experience. There’s a lot of happiness in the ordinary, when you take notice
Accept yourself, then go on ‘vacation’.
Paul Dolan of the London School of Economics commented on the role of personalities. He proposed the archetypes of ‘rough oceans’ and ‘calm seas’, or put differently, people who either prefer raves or meditation. Experiencing happiness is supported by knowing who you are, and then consciously experimenting with the opposing personality type to add a sparkle of craziness or calmness.
Three speakers, through different angles, that underlined the aspects of togetherness and agency.
The World Wellbeing Report
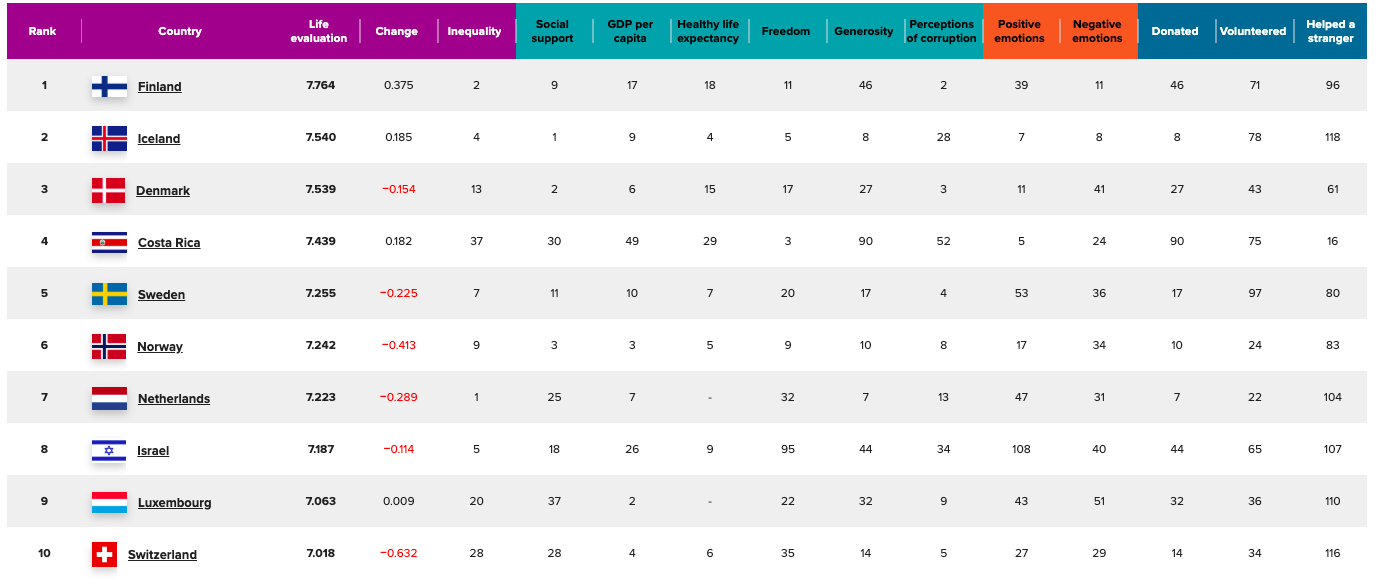
Now, let me share one more insight about the topic. I’ve long been aware that the World Happiness Report – the one where Finland topped the ranks for seven consecutive years – does not measure ‘happiness’. Instead it asks people about life evaluation or wellbeing instead. While Finns are excited about saunas, they are not known for high levels of cheerfulness and often surprised to be the ‘happiest’ nation. To provide a wider perspective, the World Happiness Report also offers a dashboard with the prevalence of positive and negative emotions. Some Latin American countries rank high on positive emotions, and some of the countries ranking low on negative emotions are in Central Asia.
Personal happiness is about togetherness and agency. And the Finns, let’s call them the champions of wellbeing.