Happy International Day of Happiness!
The International Day of Happiness must be my favourite day of the year. It is a recent invention, and only celebrates its fifth anniversary today.
Like every international day, it acts as a reminder to pay attention to the right things. To be aware of what makes us happy, and cut away some of the things that don’t. There are plenty of sources of inspiration that could help make small moments of happiness happen, like on HappyActs or Action for Happiness. Often it’s very simple: say thank you or smile to someone, take a walk in nature, or do a (Random) Act of Kindness.

Source: #HappyActs calendar, www.happyacts.org
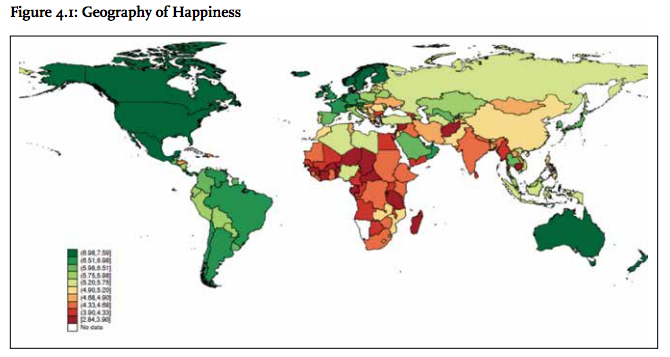
World Happiness Report
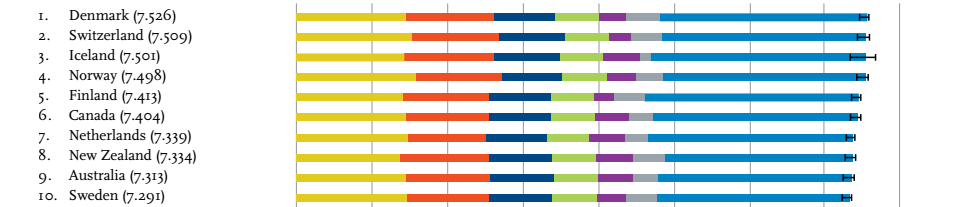
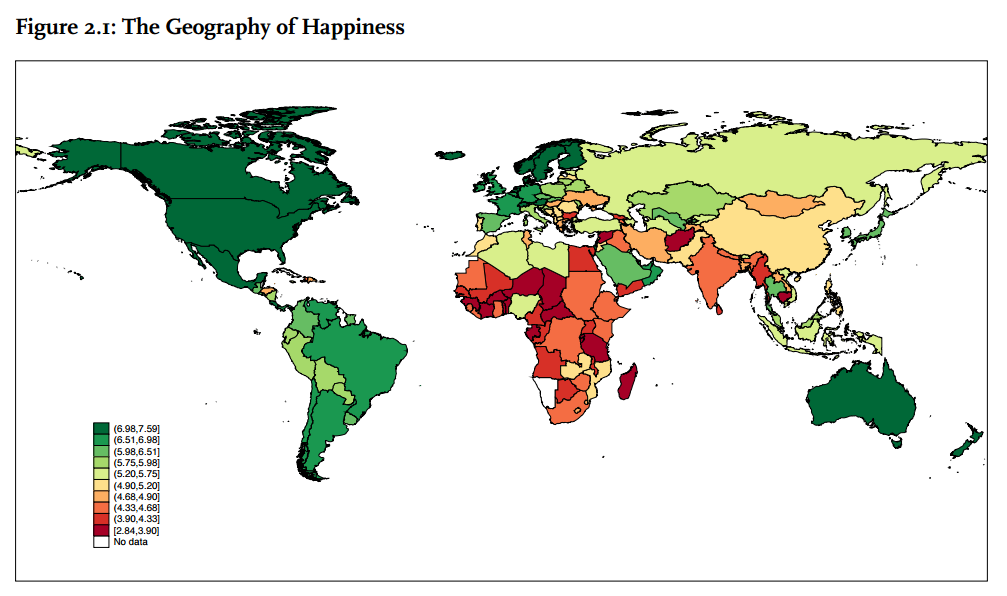
The release of the World Happiness Report is now a regular fixture on the calendar. This year, there is a new number one: Finland. It is a sign there is a lot of space at the top: the last few editions also saw Norway, Denmark and Switzerland coming first. (The authors explain that this is due to very small differences in happiness levels among these countries. Next year it could be any of those – or Iceland – again).
All these countries share high performance across the board on factors that strongly correlate with happiness: a well-developed economy, social support, a good health system, personal freedom, trust in public society, and high levels of generosity.
Having said that, there are a couple of things that are particularly interesting in the Finnish case, and that might have helped to build a lead over its competitors for first place.
- Education in Finland is of high quality. Finnish teachers are highly respected and qualified (a master’s diploma’s are required), and the country scores extremely well in international comparisons.
- Nature matters. Finland is a scarcely populated country. Having nature makes it easy to get away from daily distractions. It also facilitates an active lifestyle favouring happiness (this is also a factor that it has in common with other high performers, like Norway and Switzerland). Some Finns take this to the extreme though: the practice of winter bathing is popular in some circles. It goes like this: cut a hole in a frozen lake, dip in for a minute or so, and then run for the sauna to warm up.
- ‘Sisu‘, a concept close to hearts of Finns that helps to keep going. Many Finnish people believe in the idea of ‘sisu’, which means something like grit, resilience or determination. This attitude helps to overcome difficulties, be it a long cold winter or adverse events in life.
Does that mean that everything is perfect in Finland, or any of the other top five countries for that matter. Of course not – paradise on Earth does not exist. But Finland is a state that takes care of education, offers a natural environment that promotes an active life style, and has a cultural strong attachment to grit. These factors all help in the pursuit of happiness. If happiness is about paying attention to the right things, the Finns probably are doing a great job.