One of the common themes in my explorations on this blog has been in ‘alternative indicators’, or tools that are better equipped to measure quality of life than Gross Domestic Product (GDP). One of the most prominent ‘beyond GDP’ tools is the Social Progress Index, which I labelled “a better way to measure a good society”. And the SPI has seen a lot of development since my post of last year.
Let me start with a recap: the Social Progress Index (SPI) is developed as a broader notion of progress than GDP. It consists of 53 indicators, under the headings ‘basic human needs’ (shelter, access to clean water), ‘foundations of well-being (health, internet access) and ‘opportunity’ (human rights, social tolerance). Typically, countries tend to score higher on basic human needs, as these often are met in high and middle income countries, even if they don’t meet the same standards on the social issues. Roughly speaking, performance for opportunity is lower, even in the richest countries. The exercise has been conducted for a couple of years now. In the 2016 update released this June, the list is topped by Finland, Canada and Denmark.
Better than your peers?
The aim of the index is similar to other beyond GDP tools I discussed like the OECD’s Better Live Index. Namely, to identify the areas of ‘progress’ or well-being in which a country is doing well, and those where it is underperforming peers. The concept of peer group is an important facet: the strengths and weaknesses are listed in comparison to a 15-country group of peers with similar levels of GDP.
This type of screening tool, in theory, could be used to help countries identify in which policy areas they could invest. The thought is that by learning from over-performing peers’ best practices, countries can use their limited resources in the most efficient way, namely by generating the highest additional well-being. The SPI has expanded a lot in the last year, starting projects with the US State of Minnesota, Reykjavik, Iceland, in the capital Bogota, other cities in Colombia and elsewhere in Latin America.
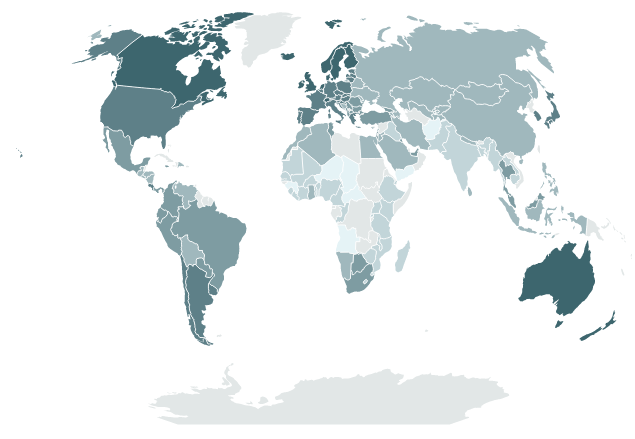
This is how the world is doing in social progress in 2016 (darker shades means higher SPI score; grey means no data). Source: SPI
Digging down to regional level
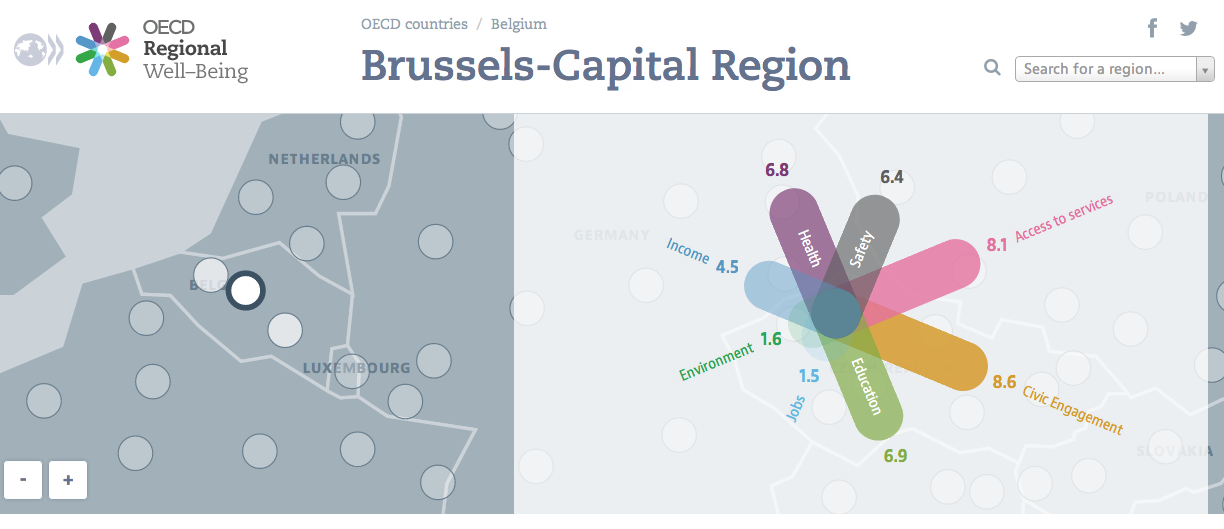
In practice, indeed, the differences within countries are more important than between countries. More granular data at the regional and local indeed provides a lot more hands-on information to policy makers on where, and how exactly, they can do better. And the Brussels capital region may be better compared to another large city, like Hamburg, then to the province of Belgian Limburg, which in turn could learn more from a region of similar GDP as East Anglia.
That’s why both the OECD and the SPI have been complemented with data on regional level. In 2016, the SPI launched a pilot overview of the 272 regions in the EU. The Commission has released the data of the exercise in February, and an updated version is due to come out in October. And where OECD uses only 11 indicators, the European regional data provide 50 out of the original 53 of the SPI. They also built in the peer group comparison in the methodology.
Once we start comparing regions with each other in Europe, very quickly the next question comes: will the unprivileged regions get more money to bridge gap?Conceptually, one could argue that using the SPI data to address specific low performance areas is a good way to aiming investment at the area where progress can be made. But money is sensitive, and in presenting the data, the Commission has been crystal clear that it doesn’t want to revise this funding policy. Nonetheless, the granular data can provide what is necessary: a better way to measure a good, regional, society.
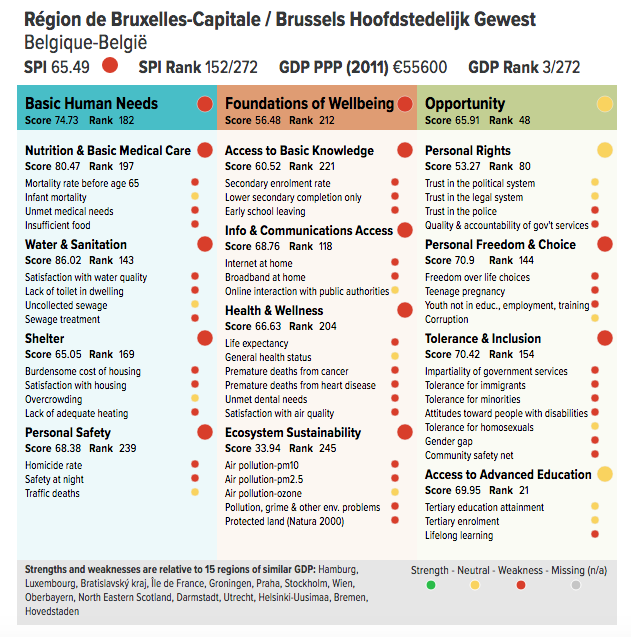
How is Brussels doing? A bit of under-performance compared to Hamburg, Prague, Vienna, and similar regions. Source: European Commission/Social Progress Imperative