I just came back from two weeks in Mexico. During these weeks, I fled the Brussels grey, rain and cold to replace it by the occasional Mexico City grey, the jungle rain, and Pacific coast warmth. Moreover, I spent a couple of days at the Foro Bienestar (International Forum of Well-Being and Development) in Guadalajara, where I was invited to speak. In the next two weeks, I’ll offer some thoughts about my own presentation on happiness and public policy and about the question ‘why are Mexicans so happy’ that was the leitmotiv of the conference. However, today I wanted to share some insights about the main points that I took home from the conference. Are you ready? Here we go!
Don’t forget the power of negative emotions
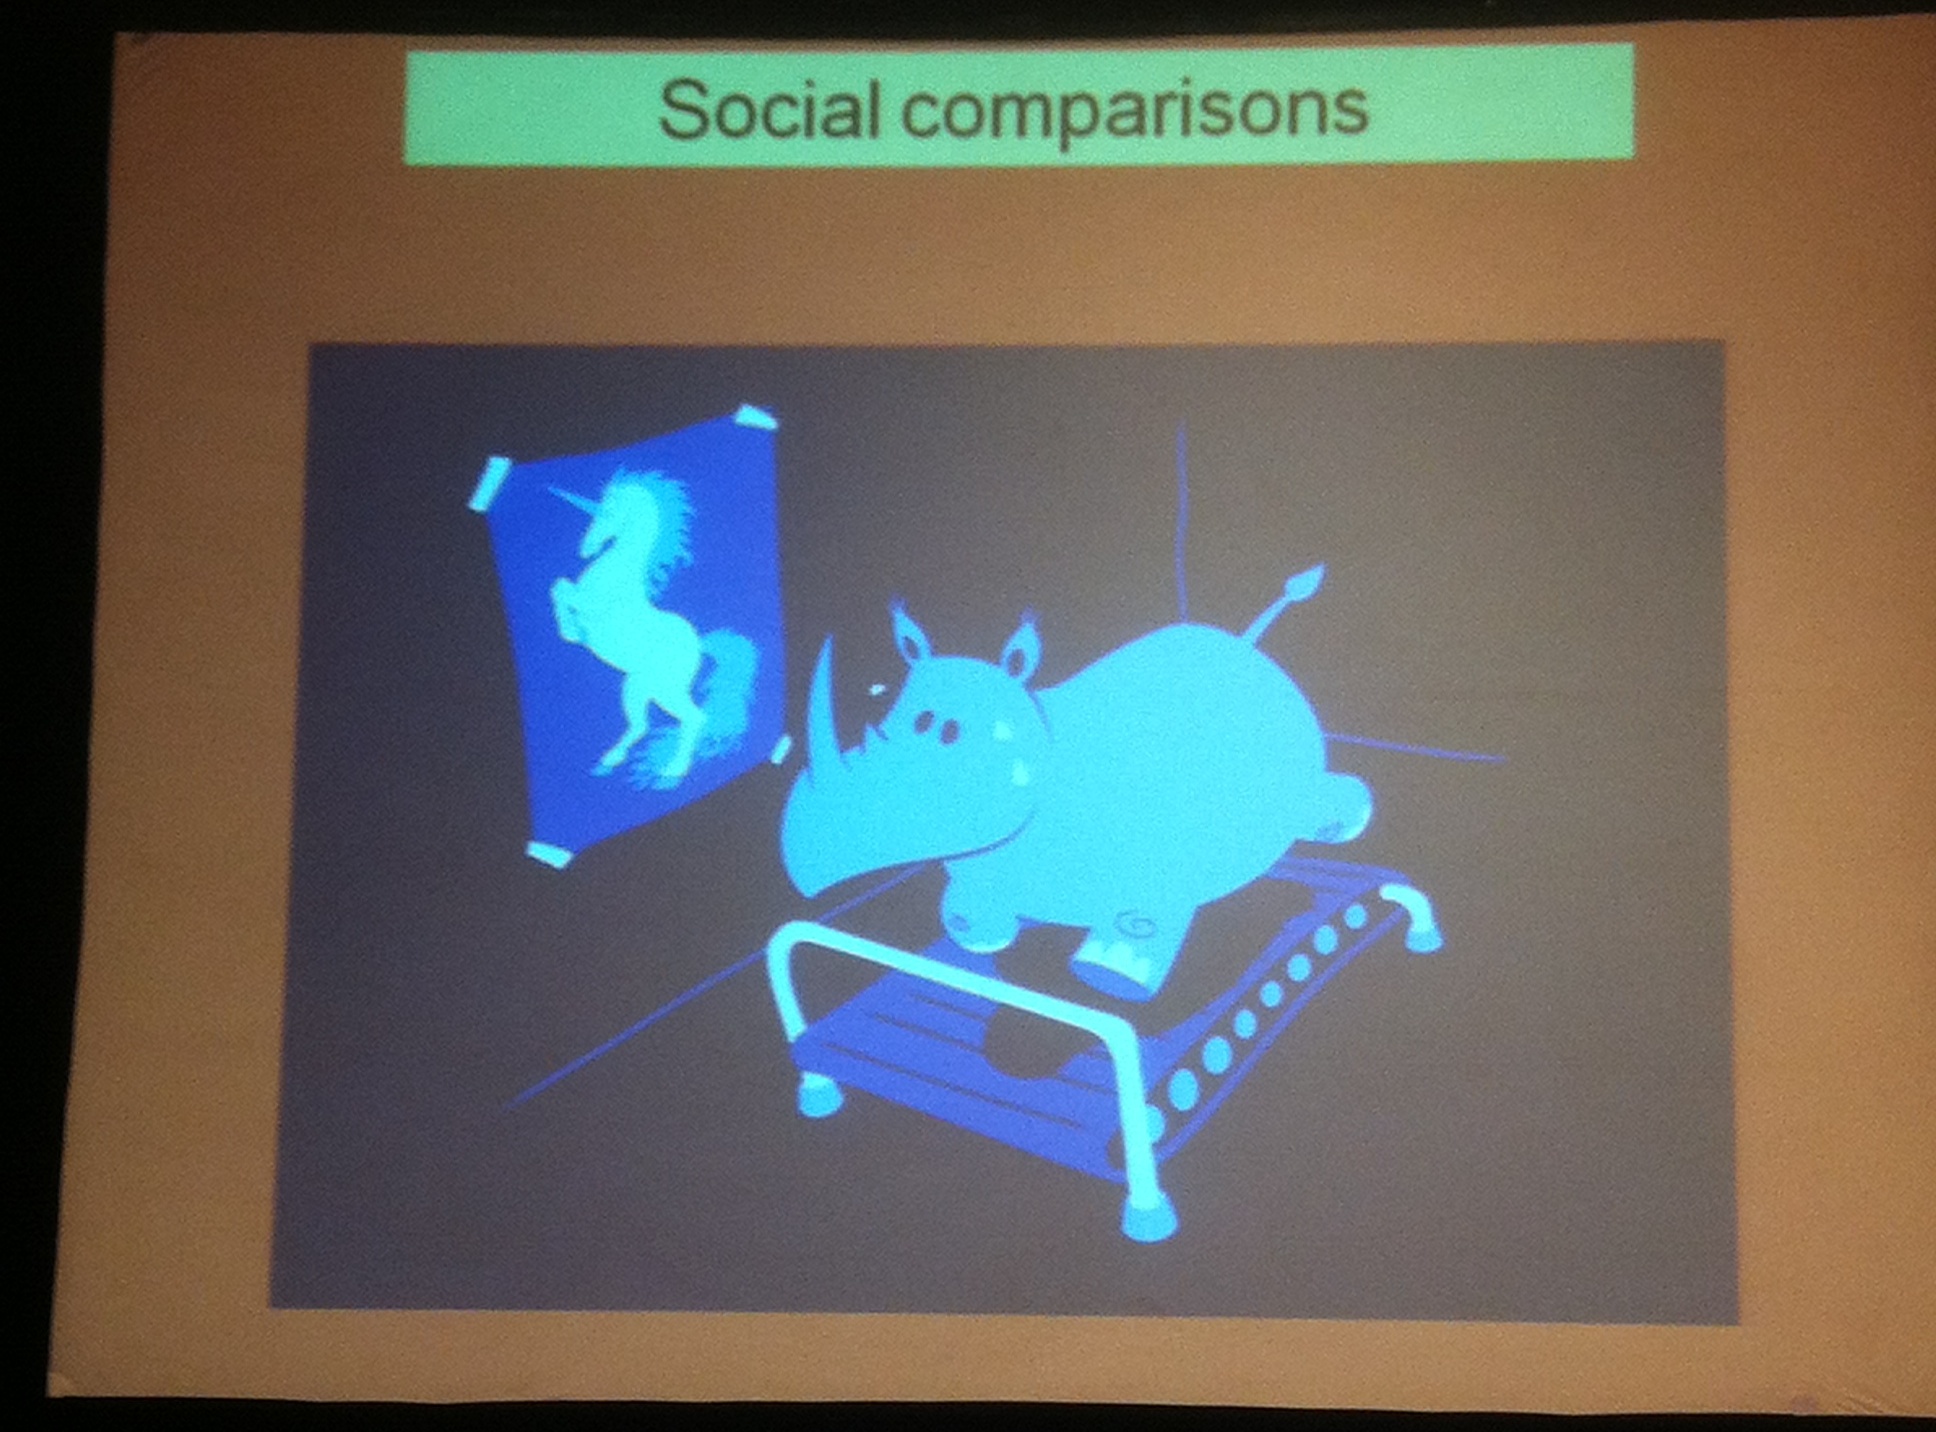
Speaking of negative emotions: this slide by Stefano Bartolini (University of Siena) shows the problem of social comparisons and happiness very well.
Most of the speakers were academics and the good thing about academics, contrary to some happiness consultants, is that they don’t allow themselves to be carried away by their enthusiasm so much that they forget that being happy all the time is not possible and not desirable. Negative emotions are a necessary counterweight to positive ones. In a simple metaphor: feelings are a mountainous landscape. Without the valleys of anger, frustrations and anxiety, the happy peaks of joy, tranquility and exaltation would not be happy peaks but part of a plain.
Robert Biswas-Diener, often labelled as a positive psychologist, brought this forward most prominently. Answering his own question ‘how happy should an individual be?’, he suggested that the ideal rate of positive and negative emotions might be positive 80% of the time and 20% negative of the time. Being happy all the time does not do justice to real and important feelings as guilt, grief and anger. For instance, as he also discusses in his book ‘The Upside of your Dark Side‘, guilt can motivate us to work harder and accomplish more than we ever could do if we’d be simply content with everything.
Measuring happiness is very, very simple and very, very, complex
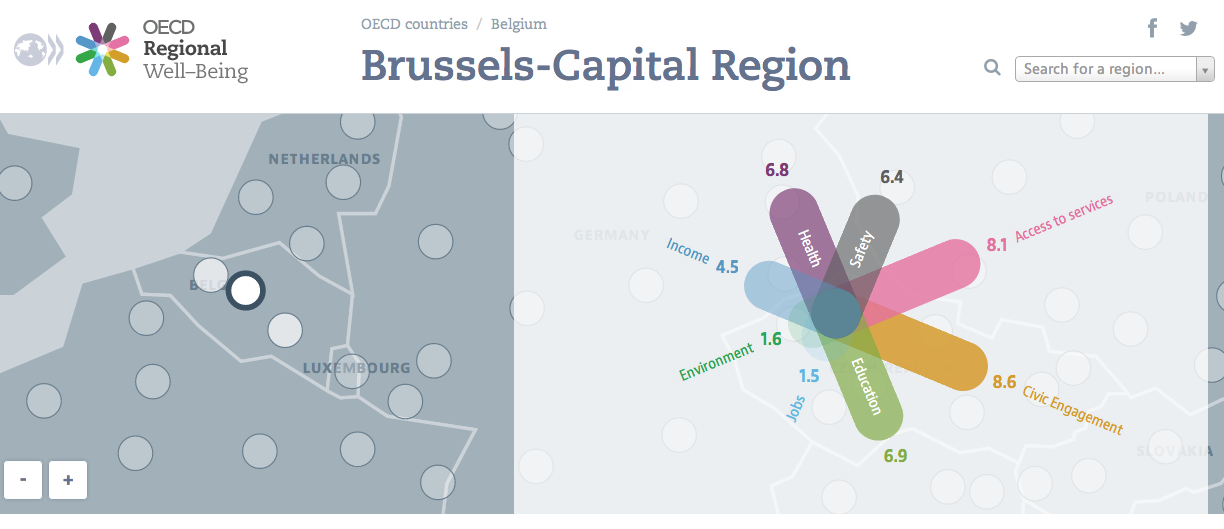
A large part of the conference was dedicated to one simple question: how do you measure happiness? It is clear that there are many ways to do so: the World Happiness Database at the Erasmus University Rotterdam knows 963 different methodologies, said Jan Ott.
But professor John Helliwell, one of the authors of the UN World Happiness Report, explained these can be summarised in a couple of simple ways. One way is to ask people how happy they are in a specific moment. This can be happiness in the ‘now’, to grasp a person’s feelings most accurately, or a moment like ‘yesterday’ or even longer ago, to prevent that events limited in time have a major influence. Such a question can be answered very quickly, without a lot of thinking. A second way is to ask a more reflective question, asking how satisfied you are with your life as a whole. Questions asking about positive or negative emotions typically give more random and diverse answers.
The debate is open on happiness as a policy objective
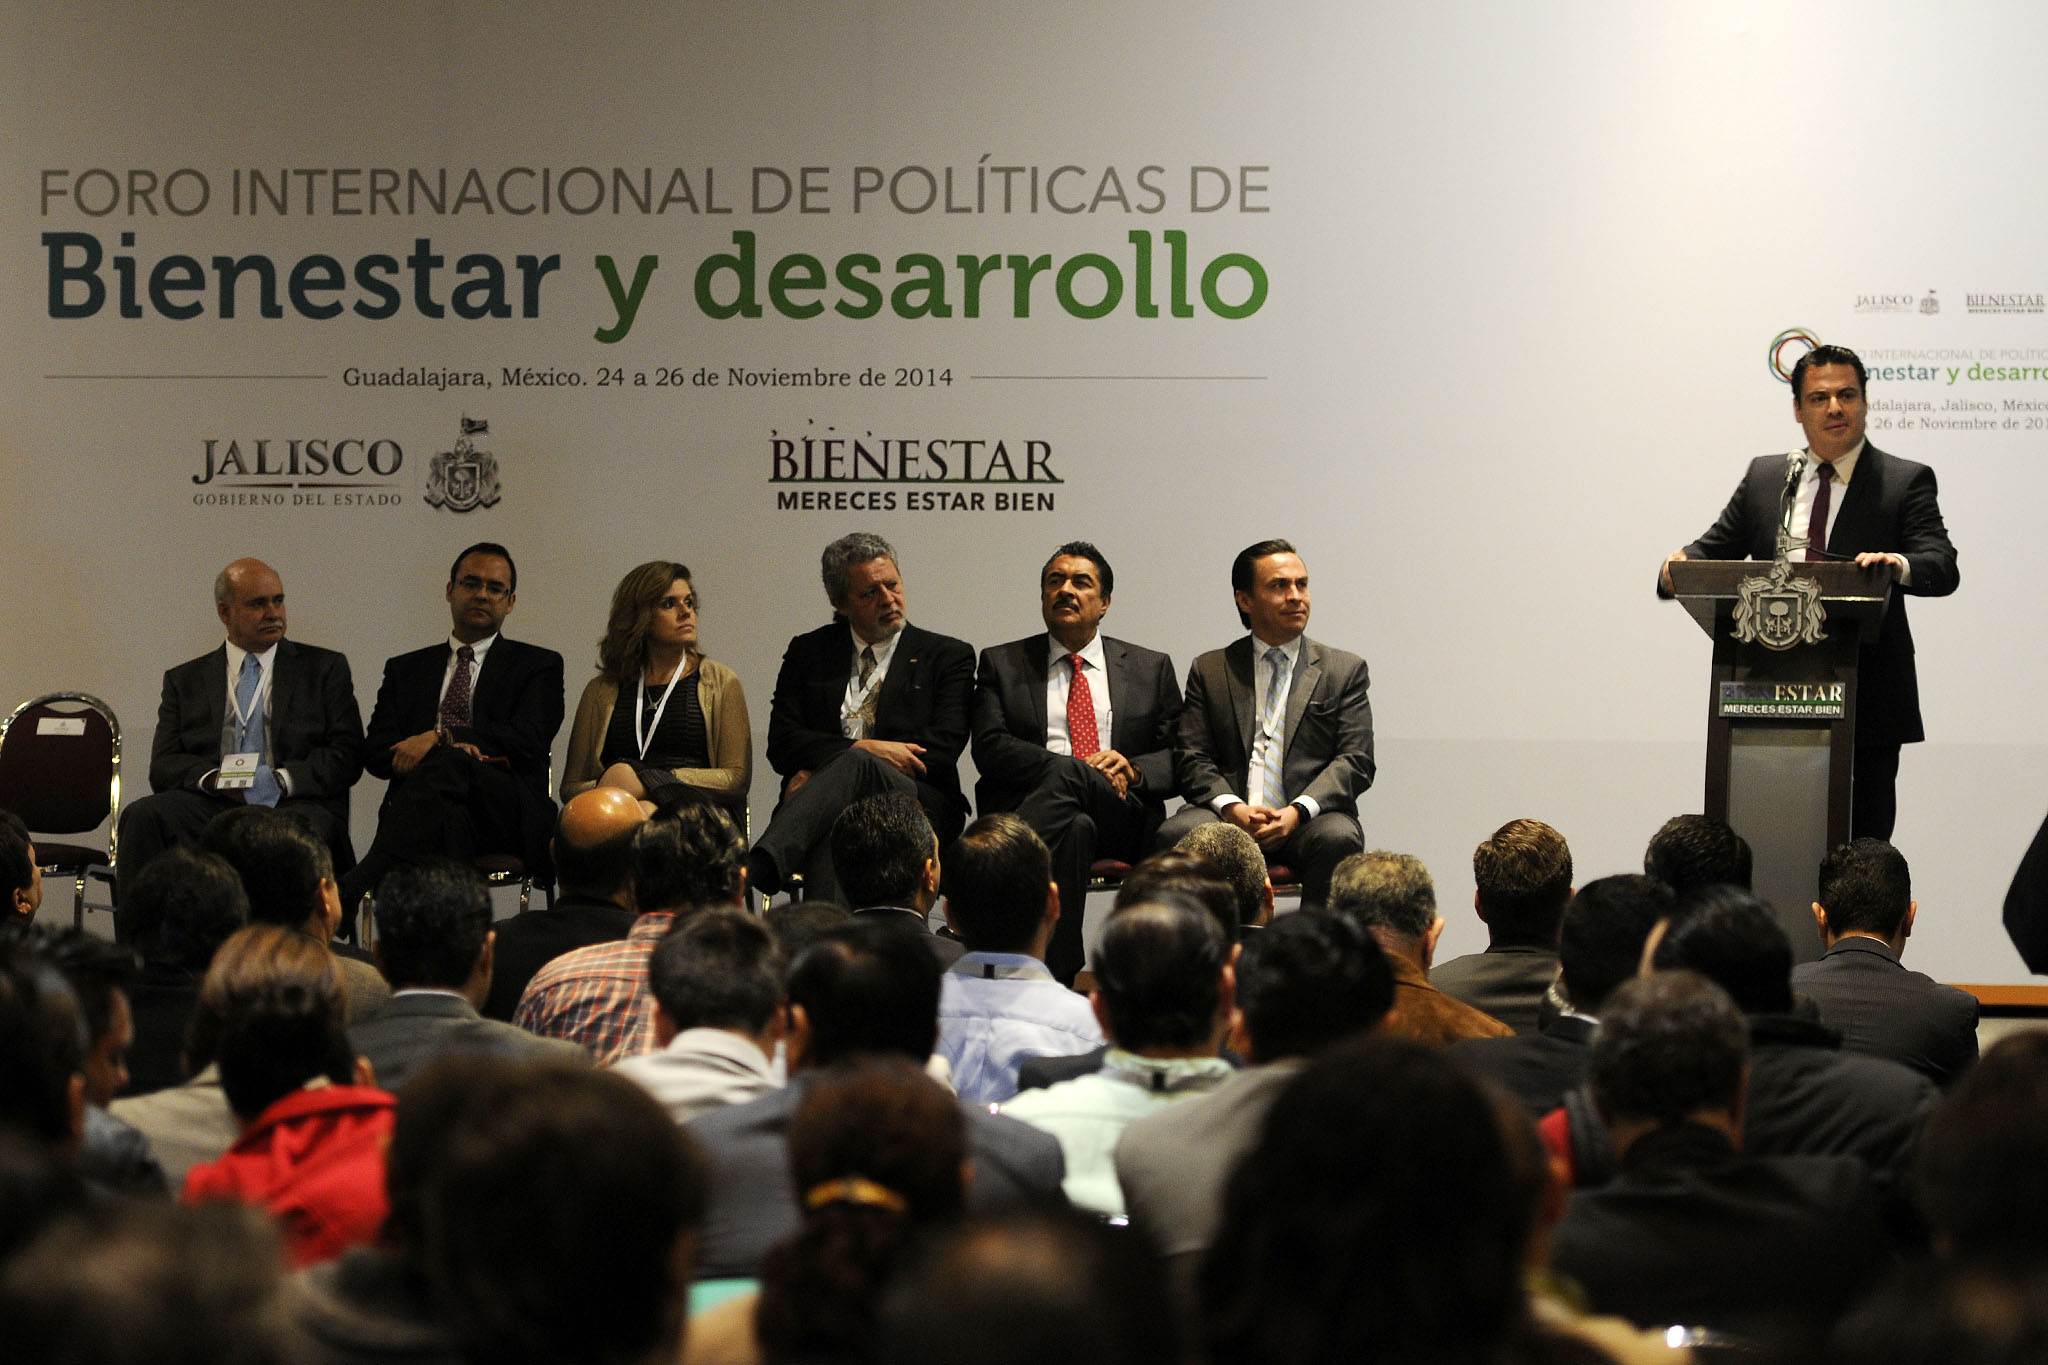
Picture from the opening session. Source: La Jornada de Jalisco.
In my opinion, it should be obvious that governments would aim to increase quality of life and well-being – happiness if you want – especially where incomes increase and poverty reduces. Still, using insights about happiness and well-being in public policy is quite scarce: another research to welcome that Jalisco, the region where Guadalajara is located, is facing the challenge. Meik Wiking, from the Danish Happiness Research Institute, identified that taking happiness as a political goal is a trend. But there is also a counter-trend: skepticism about government efforts to formulate happiness policy objectives.
Professor Bruno Frey strongly advanced the argument that with happiness as a policy objective, there would be major incentives to governments to manipulate data, for instance by excluding people with lower happiness and by falsification of indicators. In a high-level debate – the Tyson vs Ali of happiness researchers – he was taken on by professor Helliwell, who thought these risks could be reduced as methodologies will be tweaked over time and that manipulation could be constrained in a democratic society.