Tag Archives: Regions

Happiness & the City

How can growing cities ensure the well-being of their citizens isn’t sacrificed in their growth? That was one of the questions I had in mind when delivering a guest lecture on happiness to a group of students from Erasmus University Rotterdam in the Netherlands. The students, enrolled in a programme on city development, were specialising in ‘Urban Development, Wealth and Well-Being’. Studies of happiness seem to have gotten a lot more common in the few years I’ve been out of university!

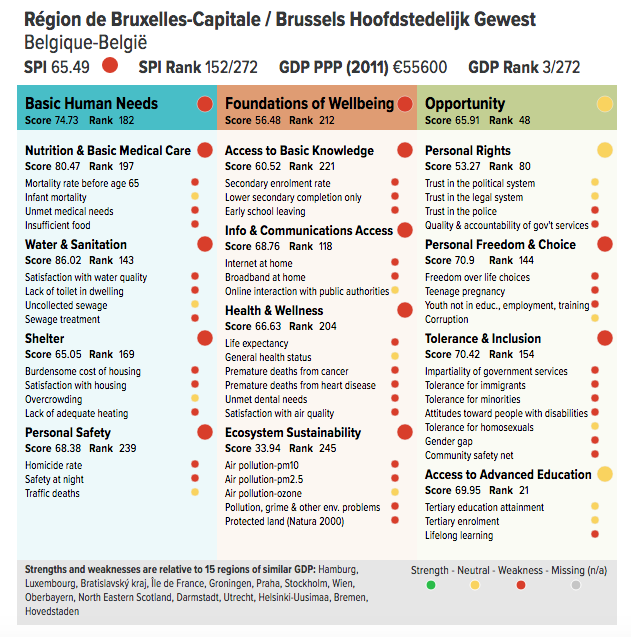
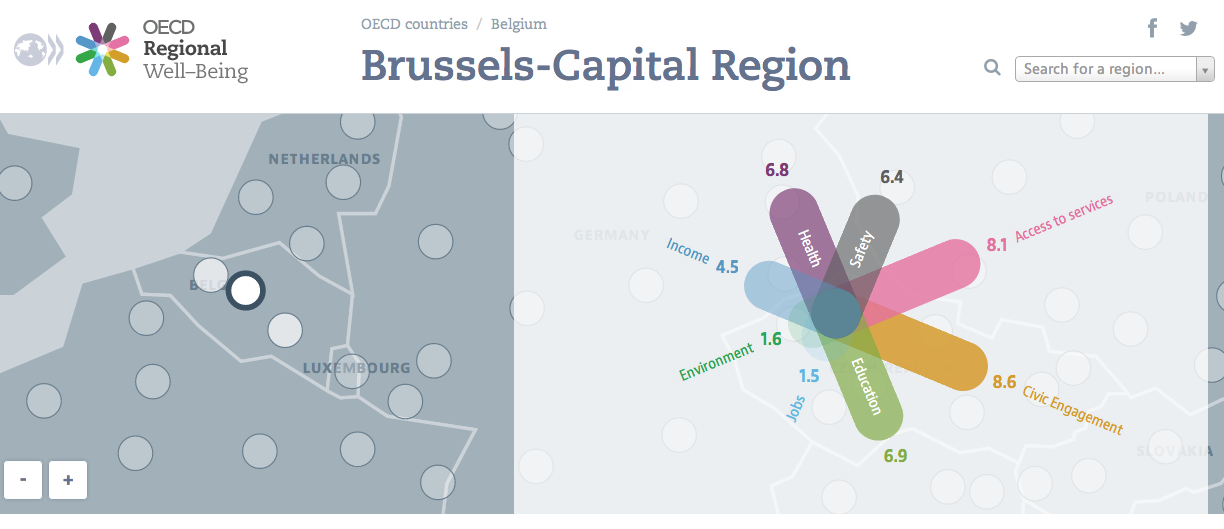
My presentation was centred on the argument that the well-being and happiness of citizens should be a leading objective in urban planning and city development. Politicians and policy-makers should use existing regional indicators, such as the OECD Better Life Index or the Social Progress Index (SPI), to monitor their performance. Comparing scores with benchmarks of their peer group can help spot weaknesses.

For instance, the Brussels region has a high GDP, but is doing worse on many other progress indicators, as the slides in the deck below show. The South Holland region of Rotterdam and The Hague ranks highly in the SPI, but shows weaknesses in education, environmental quality, and some health and safety indicators.

Students in the group seems to see the arguments, but also had critical questions: can you objectively measure what happiness or well-being is? Can you decide for someone else how much education or the environment counts for their happiness? And can we trust politicians using well-being data fairly? Or would they simply use it as a narrative to get support, without doing the actual work?

I ended the workshop with several case studies, asking the students how they would advise mayors to resolve policy issues. They had some creative solutions: for instance, one of the case studies described a dynamic city that attracts so many people that house prices saw massive increases. One, admittedly complicated, suggestion was to cap rent prices so normal people could afford to live there. This case study was meant to be similar to London. Another creative idea by the group was to build a satellite city at a reasonable distance. In this way, people could enjoy well-being in their place of residence, while also enjoying the dynamic life that London has to offer. One thing became clear: the next generation of urban planners will be thinking about happiness in their cities.

The Social Progress Index: is your region better than its peers?

One of the common themes in my explorations on this blog has been in ‘alternative indicators’, or tools that are better equipped to measure quality of life than Gross Domestic Product (GDP). One of the most prominent ‘beyond GDP’ tools is the Social Progress Index, which I labelled “a better way to measure a good society”. And the SPI has seen a lot of development since my post of last year.

Let me start with a recap: the Social Progress Index (SPI) is developed as a broader notion of progress than GDP. It consists of 53 indicators, under the headings ‘basic human needs’ (shelter, access to clean water), ‘foundations of well-being (health, internet access) and ‘opportunity’ (human rights, social tolerance). Typically, countries tend to score higher on  basic human needs, as these often are met in high and middle income countries, even if they don’t meet the same standards on the social issues. Roughly speaking, performance for opportunity is lower, even in the richest countries. The exercise has been conducted for a couple of years now. In the 2016 update released this June, the list is topped by Finland, Canada and Denmark.

Better than your peers?

The aim of the index is similar to other beyond GDP tools I discussed like the OECD’s Better Live Index. Namely, to identify the areas of ‘progress’ or well-being in which a country is doing well, and those where it is underperforming peers. The concept of peer group is an important facet: the strengths and weaknesses are listed in comparison to a 15-country group of peers with similar levels of GDP.

This type of screening tool, in theory, could be used to help countries identify in which policy areas they could invest. The thought is that by learning from over-performing peers’ best practices, countries can use their limited resources in the most efficient way, namely by generating the highest additional well-being. The SPI has expanded a lot in the last year, starting projects with the US State of Minnesota, Reykjavik, Iceland, in the capital Bogota, other cities in Colombia and elsewhere in Latin America.

This is how the world is doing in social progress in 2016 (darker shades means higher SPI score). Source: SPI

This is how the world is doing in social progress in 2016 (darker shades means higher SPI score; grey means no data). Source: SPI

Digging down to regional level

In practice, indeed, the differences within countries are more important than between countries. More granular data at the regional and local indeed provides a lot more hands-on information to policy makers on where, and how exactly, they can do better. And the Brussels capital region may be better compared to another large city, like Hamburg, then to the province of Belgian Limburg, which in turn could learn more from a region of similar GDP as East Anglia.

That’s why both the OECD and the SPI have been complemented with data on regional level. In 2016, the SPI launched a pilot overview of the 272 regions in the EU. The Commission has released the data of the exercise in February, and an updated version is due to come out in October. And where OECD uses only 11 indicators, the European regional data provide 50 out of the original 53 of the SPI. They also built in the peer group comparison in the methodology.

Once we start comparing regions with each other in Europe, very quickly the next question comes: will the unprivileged regions get more money to bridge gap?Conceptually, one could argue that using the SPI data to address specific low performance areas is a good way to aiming investment at the area where progress can be made. But money is sensitive, and in presenting the data, the Commission has been crystal clear that it doesn’t want to revise this funding policy. Nonetheless, the granular data can provide what is necessary: a better way to measure a good, regional, society.

How is Brussels doing? A bit of under-performance compared to Hamburg, Prague, Vienna, and similar regions. Source: European Commission/Social Progress Imperative

How is Brussels doing? A bit of under-performance compared to Hamburg, Prague, Vienna, and similar regions. Source: European Commission/Social Progress Imperative

Where the life is good: the OECD’s Regional Well-Being index

[Gross Domestic Product] measures everything in short, except that which makes life worthwhile

Robert F. Kennedy, 1968

The Organization for Economic Cooperation and Development (OECD) has taken Kennedy’s words to heart. Through its Better Life Index, it is conducting an impressive work programme to analyse quality of life in the 34 developed countries that constitute its membership. The OECD index provides a broad overview of quality life, measuring the performance of countries on various important issues, from housing to environment and from civic engagement to life satisfaction. Like  the Gross National Happiness (GNH) concept, the Better Life Index indicates what the good places to live are in a much broader sense than the mere economic data of GDP could do. Wealth’s correlation with happiness is limited at best, scientists have shown time and again.

But there remains a problem with this kind of national indices: they provide national averages – and do not say anything about the extremes and the equality of the data. California differs from Vermont. Sicily is not the same as Südtirol, the German-speaking part of Italy. To take account of regional differences in quality of life, the OECD has now released a similar website on regional well-being.

Some of the observations:

  • The balance varies a lot across regions. In California, income, jobs and education are at higher levels then in Vermont, but for safety and civic engagement the golden state is a lot worse off than Vermont.
  • Brussels is performing a lot worse on jobs (1.5 points out of 10) and environment (1.6) then I would think, but apparently has a high level of civic engagement (8.6).
  • Across the board, Dutch regions reach high scores, except for income and environment. All over the Netherlands, safety and access to services are close to perfect 10s.
  • Südtirol (or province of Bolzano) is indeed a different world from Sicily. The differences are most striking in the rate for jobs (8.8 vs 0.5). Italy’s figures confirm the large divide in incomes between North and South, whilst incomes are most equal in Austria.
  • Czech regions, to my mind, score surprisingly bad in health but almost all have full scores of 10 for education, here defined as the level of people with secondary education or higher.
  • The Mexican region of Jalisco has adopted well-being as a guiding principle in its policies. Still, it has a lot of space for improvement when compared with regions of richer OECD countries. The region already scores well on jobs and environment. And as a survey from a local NGO suggest, the comparable low scores do not mean that people perceive a low level of well-being. According to their figures, 67% in the region feels prosperous.
Picture 1

Brussels Capital Region, the region where I live, scores well on civic engagement and access to services, but has a lot to improve for jobs and environment. Source: OECD

So What?

Lists and rankings have a broader use than providing bloggers something to browse through on a Sunday night. They can bring order to life – be it by classifying which celebrities are hot and which are not lists, listing the best goals of the World Cup so far (no surprise, Flying Dutchman van Persie tops the list), or of countries which provide the most creative ideas (Ireland is first according to TED).

The OECD list, similarly, provides a benchmark of how regions performance. Seeing where you outperform peers or lag behind gives a motivation to improve. The index can help regions to decide where to focus their resources, and thus make better-informed decision how to spend civil servants’ time and money. As our representatives, politicians and administration should learn from these data. The data can help our administration to perform their duty: continuous improvement of our collective well-being.

Examples of well-being projects in some regions are already included on the OECD site.