Tag Archives: Social Progress Index

Happiness & the City

How can growing cities ensure the well-being of their citizens isn’t sacrificed in their growth? That was one of the questions I had in mind when delivering a guest lecture on happiness to a group of students from Erasmus University Rotterdam in the Netherlands. The students, enrolled in a programme on city development, were specialising in ‘Urban Development, Wealth and Well-Being’. Studies of happiness seem to have gotten a lot more common in the few years I’ve been out of university!

My presentation was centred on the argument that the well-being and happiness of citizens should be a leading objective in urban planning and city development. Politicians and policy-makers should use existing regional indicators, such as the OECD Better Life Index or the Social Progress Index (SPI), to monitor their performance. Comparing scores with benchmarks of their peer group can help spot weaknesses.

For instance, the Brussels region has a high GDP, but is doing worse on many other progress indicators, as the slides in the deck below show. The South Holland region of Rotterdam and The Hague ranks highly in the SPI, but shows weaknesses in education, environmental quality, and some health and safety indicators.

Students in the group seems to see the arguments, but also had critical questions: can you objectively measure what happiness or well-being is? Can you decide for someone else how much education or the environment counts for their happiness? And can we trust politicians using well-being data fairly? Or would they simply use it as a narrative to get support, without doing the actual work?

I ended the workshop with several case studies, asking the students how they would advise mayors to resolve policy issues. They had some creative solutions: for instance, one of the case studies described a dynamic city that attracts so many people that house prices saw massive increases. One, admittedly complicated, suggestion was to cap rent prices so normal people could afford to live there. This case study was meant to be similar to London. Another creative idea by the group was to build a satellite city at a reasonable distance. In this way, people could enjoy well-being in their place of residence, while also enjoying the dynamic life that London has to offer. One thing became clear: the next generation of urban planners will be thinking about happiness in their cities.

A world beyond GDP: are we ready yet?

On the road to discover how happiness works, I learned a lot about happiness in my own personal life – and in your personal lives, too. I’ve also gained a lot of insight in happiness at work. But the main focus of my research effort has been around another question: is there something our governments can do to make us happy?

Allow me to dwell on this question today, before I start my ‘sabbatical’ as a blogger.

I am sure that governments can make us happier, and that they should aim to do so. There are many governments that are taking happiness-based data into account when setting policies. Gross National Happiness (GNH) in Bhutan is more of philosophical guide than a hands-on policy tool, but it shapes the narrative of the government’s action. Regions in the EU and elsewhere learn from the OECD Better Life Index and Regional Well-Being Index and from Social Progress Index (SPI). And on the local level, there is an uncountable number of projects where municipalities and social society players take happiness as inspiration in social, environmental and other projects.


GDP, an increasingly poor measure of prosperity

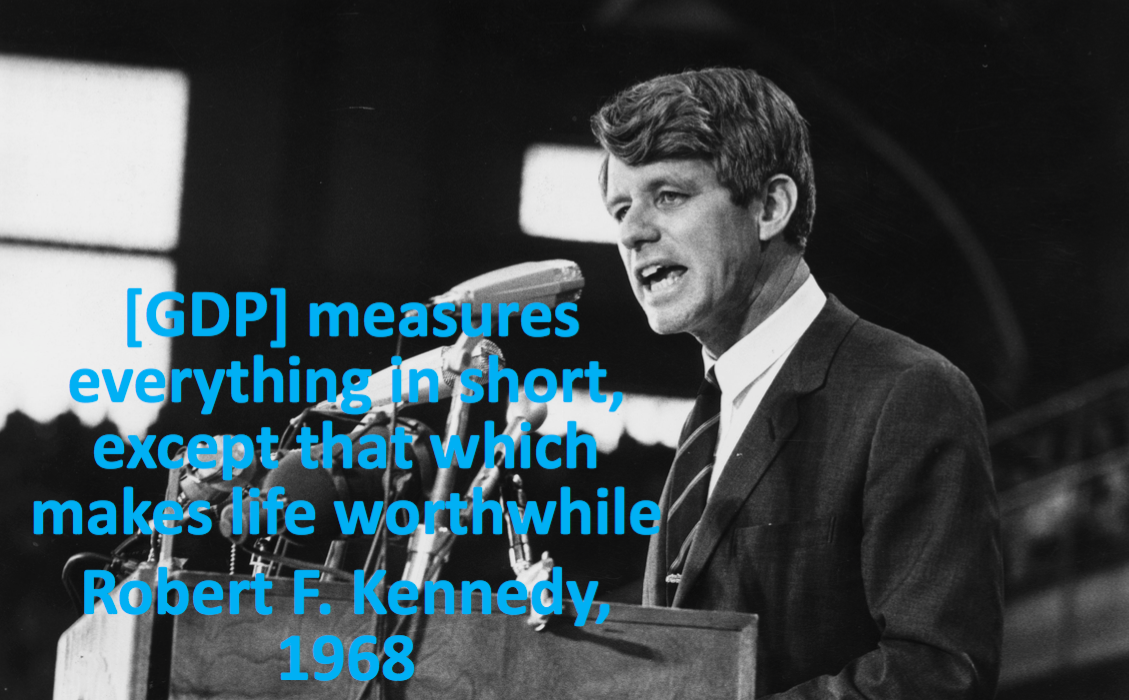
On one of the bigger and more abstract questions I have countered on the road is whether our data helps us to work on happiness. I’ve time and again argued that Gross Domestic Product (GDP) has plenty of limitations. Instead, I assessed the virtue of alternative indicators mentioned above. And I have been far from alone in this endeavour. Back in 1968, Robert F. Kennedy already decried that GDP measures everything, except that which makes life worthwhile. In the last ten years, the debate on ‘beyond GDP’ has been particularly fierce. A cover article of the Economist some months ago summarised these limitations very well, and labelled GDP “an increasingly poor measure of prosperity”.

Can we do without GDP? Does the acceptance of the constraints of GDP mean that a real competitor has risen to the stage? Did we get anywhere in those ten years?

After three years of researching, I fear that my answers: no, we cannot yet do without . No, there is no real competitor. And no, maybe we haven’t made as much progress as we like to think. In the remainder of this post, I explain why.

Kennedy GDP


Can we do without GDP?

Ever since its creation in the 1930s, GDP provides important information about national accounts and the size of the economy. It simply measures all production that has been created in a certain territory in a year. These data are important to inform decisions on investment, government spending, and taxation. But all too often, GDP becomes a proxy for progress or prosperity. As a tool, it only measures part of productive economy: GDP falls when a man marries his maid. Indeed, if they don’t increase the economy, GDP discounts social and environmentally desirable activities, such as household work.

Furthermore, GDP is an artificial number. Figures are routinely revised, often upwards and by large margins. After a new method is used in Ireland, GDP growth is not an already significant 7.6% over 2015, but a whopping 26% as a result of some accounting tricks. Imagine the consequences: in terms GDP per capita, Irish are suddenly a lot richer, and the budget deficit shrinks by the stroke of a pen!

Despite all these limitations, GDP is probably a bit like democracy. In Churchill’s words, democracy is the worst form of government, except for all the others. We still need GDP as a tool to measure economic activity, to make sense of poverty, and to determine how much tax we need to pay to run our common society. It might still be the best we can do?


Is there any competition?

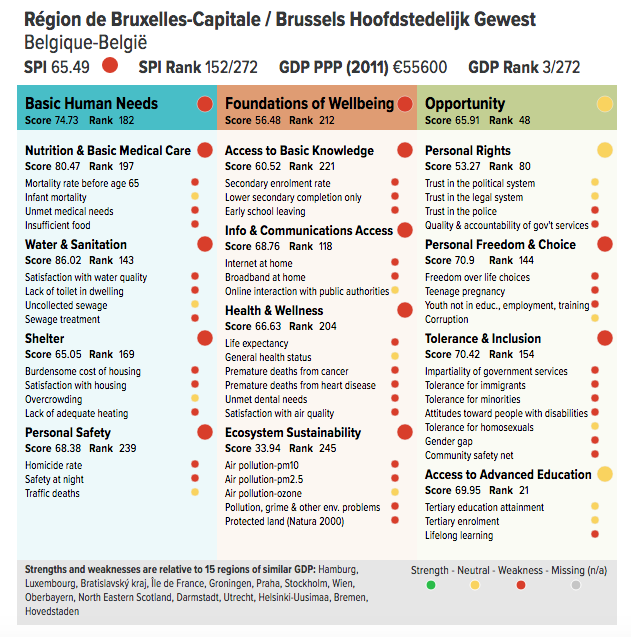
Or can we? In this blog, I’ve covered many alternative indicators, from GNH to the OECD Better Life Index to the SPI, but also the UN’s Humanitarian Development Index and even the Happy Planet Index. In my view, these are good as part of driving the narrative for a broader sense of well-being and progress. Tools like the OECD Better Life Index, GNH and the SPI can be helpful in spotting where governments need to focus resources to increase quality of life.

But they aren’t appropriate for all economic purposes. All indicators have a stronger element of arbitrary and political choices. As such, they’re too political to be used in a more economic context. Countries simply would refuse to determine financial contributions to the United Nations based on performance in the HDI, or EU regional funds based on a regional SPI score. GDP too often is seen as the more ‘objective’ metric, and even though it is not objective or stable, it is doing better than alternatives. Intriguingly, GDP is also strongly correlated with performance like HDI and SPI, even around 80% for the latter index. Although the SPI is making advances in feeding into policy, altogether none of the indices is truly challenging the position of GDP as things stand in 2016. And I don’t think it will be very different in 2018, 2020, or 2025 for that matter.


Did we make so much progress?

Then, how much progress did we make in several decades of an academic debate, and overall ten years of statistical revolution? A lot has happened. Our insights in quality of life and happiness is a deeper than at any moment in history. OECD statistical offices are now routinely gathering data on subjective wellbeing, and there is a vibrant research agenda in positive psychology and related fields. Academics and practicioners, myself included, happily travel to Bhutan to learn about GNH.

But what was generated out of this debate? Are we paying more attention to quality of life after the financial crisis? A single indicator truly competing with GDP has not been born. UN and EU authorities, as well as national governments and parliaments, have underlined the importance of alternative ways of measuring progress. But the reign of GDP has never been in danger. My feeling is that GDP is simply too important, and the alternatives too complex. I fear that we’re not ready for this revolution yet.


Time for a sabbatical

Three years on the road, my doubts on the alternatives to GDP are back. I see the beyond GDP agenda as a powerful discussion, but one that has not generated a strong enough alternative to truly challenge GDP.

On a personal level, this means that a reflection on my work is needed. Do I need to focus on something else? Do I need to work harder, or differently, for a state of happiness? Did I fail myself?

For the moment, I’ll take a break from this blog. I’ll reflect on other steps. I deserve to take some time off for a sabbatical to read more and generate other ideas. But I am sure I’ll be back with a new programme.

Because a life, enjoyably wasted in the pursuit of happiness, is a life worth wasting. Farewell!

The Social Progress Index: is your region better than its peers?

One of the common themes in my explorations on this blog has been in ‘alternative indicators’, or tools that are better equipped to measure quality of life than Gross Domestic Product (GDP). One of the most prominent ‘beyond GDP’ tools is the Social Progress Index, which I labelled “a better way to measure a good society”. And the SPI has seen a lot of development since my post of last year.

Let me start with a recap: the Social Progress Index (SPI) is developed as a broader notion of progress than GDP. It consists of 53 indicators, under the headings ‘basic human needs’ (shelter, access to clean water), ‘foundations of well-being (health, internet access) and ‘opportunity’ (human rights, social tolerance). Typically, countries tend to score higher on  basic human needs, as these often are met in high and middle income countries, even if they don’t meet the same standards on the social issues. Roughly speaking, performance for opportunity is lower, even in the richest countries. The exercise has been conducted for a couple of years now. In the 2016 update released this June, the list is topped by Finland, Canada and Denmark.

Better than your peers?

The aim of the index is similar to other beyond GDP tools I discussed like the OECD’s Better Live Index. Namely, to identify the areas of ‘progress’ or well-being in which a country is doing well, and those where it is underperforming peers. The concept of peer group is an important facet: the strengths and weaknesses are listed in comparison to a 15-country group of peers with similar levels of GDP.

This type of screening tool, in theory, could be used to help countries identify in which policy areas they could invest. The thought is that by learning from over-performing peers’ best practices, countries can use their limited resources in the most efficient way, namely by generating the highest additional well-being. The SPI has expanded a lot in the last year, starting projects with the US State of Minnesota, Reykjavik, Iceland, in the capital Bogota, other cities in Colombia and elsewhere in Latin America.

This is how the world is doing in social progress in 2016 (darker shades means higher SPI score). Source: SPI

This is how the world is doing in social progress in 2016 (darker shades means higher SPI score; grey means no data). Source: SPI

Digging down to regional level

In practice, indeed, the differences within countries are more important than between countries. More granular data at the regional and local indeed provides a lot more hands-on information to policy makers on where, and how exactly, they can do better. And the Brussels capital region may be better compared to another large city, like Hamburg, then to the province of Belgian Limburg, which in turn could learn more from a region of similar GDP as East Anglia.

That’s why both the OECD and the SPI have been complemented with data on regional level. In 2016, the SPI launched a pilot overview of the 272 regions in the EU. The Commission has released the data of the exercise in February, and an updated version is due to come out in October. And where OECD uses only 11 indicators, the European regional data provide 50 out of the original 53 of the SPI. They also built in the peer group comparison in the methodology.

Once we start comparing regions with each other in Europe, very quickly the next question comes: will the unprivileged regions get more money to bridge gap?Conceptually, one could argue that using the SPI data to address specific low performance areas is a good way to aiming investment at the area where progress can be made. But money is sensitive, and in presenting the data, the Commission has been crystal clear that it doesn’t want to revise this funding policy. Nonetheless, the granular data can provide what is necessary: a better way to measure a good, regional, society.

How is Brussels doing? A bit of under-performance compared to Hamburg, Prague, Vienna, and similar regions. Source: European Commission/Social Progress Imperative

How is Brussels doing? A bit of under-performance compared to Hamburg, Prague, Vienna, and similar regions. Source: European Commission/Social Progress Imperative

Social progress: a better way to measure a good society

For too long, Gross Domestic Product (GDP) has been the king of the indicators for public policy. Money makes the world go round. And GDP measures it. GDP emerged in the 1930s as a metric to measure the size of national accounts and inform policy makers’ decisions. Since, it has developed into a tool to benchmark countries’ performance: GDP growth is equated to progress.

GDP and beyond

Within the beyond GDP movement, many people have challenged this dominance, arguing that a good society is a lot more than economic performance. Social and environmental externalities are discounted in GDP. For instance, economists calculated that the Gulf of Mexico oil spill resulted in a higher GDP! And even GDP’s creator, economist Simon Kuznets, was aware of these limitations. When preparing the pile of statistic data for the US Congress in 1933, he noted that:

The welfare of a nation can scarcely be inferred from a measurement of national income.

Since, many have challenged the dominance as a benchmark in the countries’ annual performance reviews. Most competing indices aim to rebalance GDP, by providing economic performance and add other data in areas as social matters, environment and education. This is the case for indicators like the Humanitarian Development Index (HDI), the OECD’s Better Life Index and Bhutan’s Gross National Happiness.

And further beyond… all economic data!

The Social Progress Index (SPI), however, has a different approach.

The SPI differentiates itself from other challengers to GDP by its unique conceptual choice to stay away from economic data. Instead, it measures social progress via 52 concrete outcomes assessing three key indicators to measure progress: basic human needs, ‘foundations of well-being’, and opportunity (see more in this eloquent TEDx talk).

These concepts are assessed via a series of questions asking about people’s experiences in many aspects that matter for quality of life: how many people have shelter and sufficient water? Do people live in a sustainable ecosystem? How many people experience discrimination? Survey data allow to compare such outcomes based on what people feel, rather than by measuring social issues via public expenditure or laws.


Source: data from Social Progress Imperative, available here.

Social progress does not equate happiness

The SPI does not measure happiness or aim to do so. Still, a glance at the wealth of data produced by the SPi suggest that their ranking broadly overlaps with the data from the World Happiness Report. All the top time countries are the same, but in a different order. Switzerland, Iceland and Denmark form the top-three in happiness; for social progress it’s Norway, Sweden and Switzerland.

But there are some differences: especially Latin American countries seem to rank lower in the SPI. Countries like Costa Rica, Mexico, Brazil, Venezuela and Panama benefit from a ‘Latin American happiness bonus and make it to the top-25 in happiness, but fall short of the top-25 in social progress. To the contrary, some highly developed countries (Germany, France, Japan, South Korea) combine lower levels of happiness with higher levels of social progress.

A different data set for policy makers 

The main use of SPI as a policy tool is that it is adds knowledge on progress without building on economic data. From that perspective, it may be surprising that there nevertheless is a solid correlation of 0.78 between GDP and SPI. But SPI allows policy makers to make assessment from a different angle. The main benefit is to identify areas where a country is shortcoming comparing to peers with similar GDP levels, and to strengthen the information base about interventions that can address lower performance.

In recent years, policy makers’ interest in beyond GDP indicators has steadily risen. The SPI is also benefitting from this. The European Commission has started talks to integrate the SPI to monitor regional policy outcomes. And in the US, where social progress and happiness are lagging behind economic strength, several local and state level politicians have started to integrate SPI information in their dashboard of monitored outcomes. For instance, the city of Somerville, Massachusetts, has started analysing tailored SPI analytics on the local level. And in the state of Michigan, social progress indicators are included in a set of key performance indicators.

Data for a good society

This is exactly what alternative indicators should do. GDP has a value. Economic data provide a useful understanding about people’s lives. But if you want to find out what a good society is, and whether you are on an upward or downward trend, there is a lot more to watch. The SPI provides a great contribution to help policymakers find out on which areas they should work to make their country progress.