Happiness is always a good thing, right? At least, all over my life I’ve assumed that happiness is something pretty and beautiful, and always worth pursuing for its own sake.
A recent TEDx talk by Meik Wiking of the Danish Happiness Research Institute has opened my eyes. Everything in life has a dark side, and that even applies to happiness.
800,000 suicides per year
Wiking starts his talk on The Dark Side of Happiness by pointing out that around 500 Danes commit suicide every year, although they live in the country that tops the World Happiness Report as happiest country of the world. Some people think that suicide rates are particularly high in Nordic countries like Sweden, Finland and Denmark, with long and dark winters (sometimes it is even thought that happiness rates remain high, because unhappy people filter themselves out by suicide!).
This is not the case, and many countries in Eastern Europe and across the East of Africa rank worse, as the WHO data show. To some extent, suicide rates might be affected by cultural factors, such as the high pressure to perform and strong shame notions in Korea and Japan. Lower levels in a country like Mexico may also be a result of strong social support. Either way, every year around 800,000 commit suicide. That figure is massive, especially when you consider that the death toll of one the most bloody conflicts and biggest human tragedies always in our headlines, the Syrian civil war, is estimated at around 400,000 in the last five years.
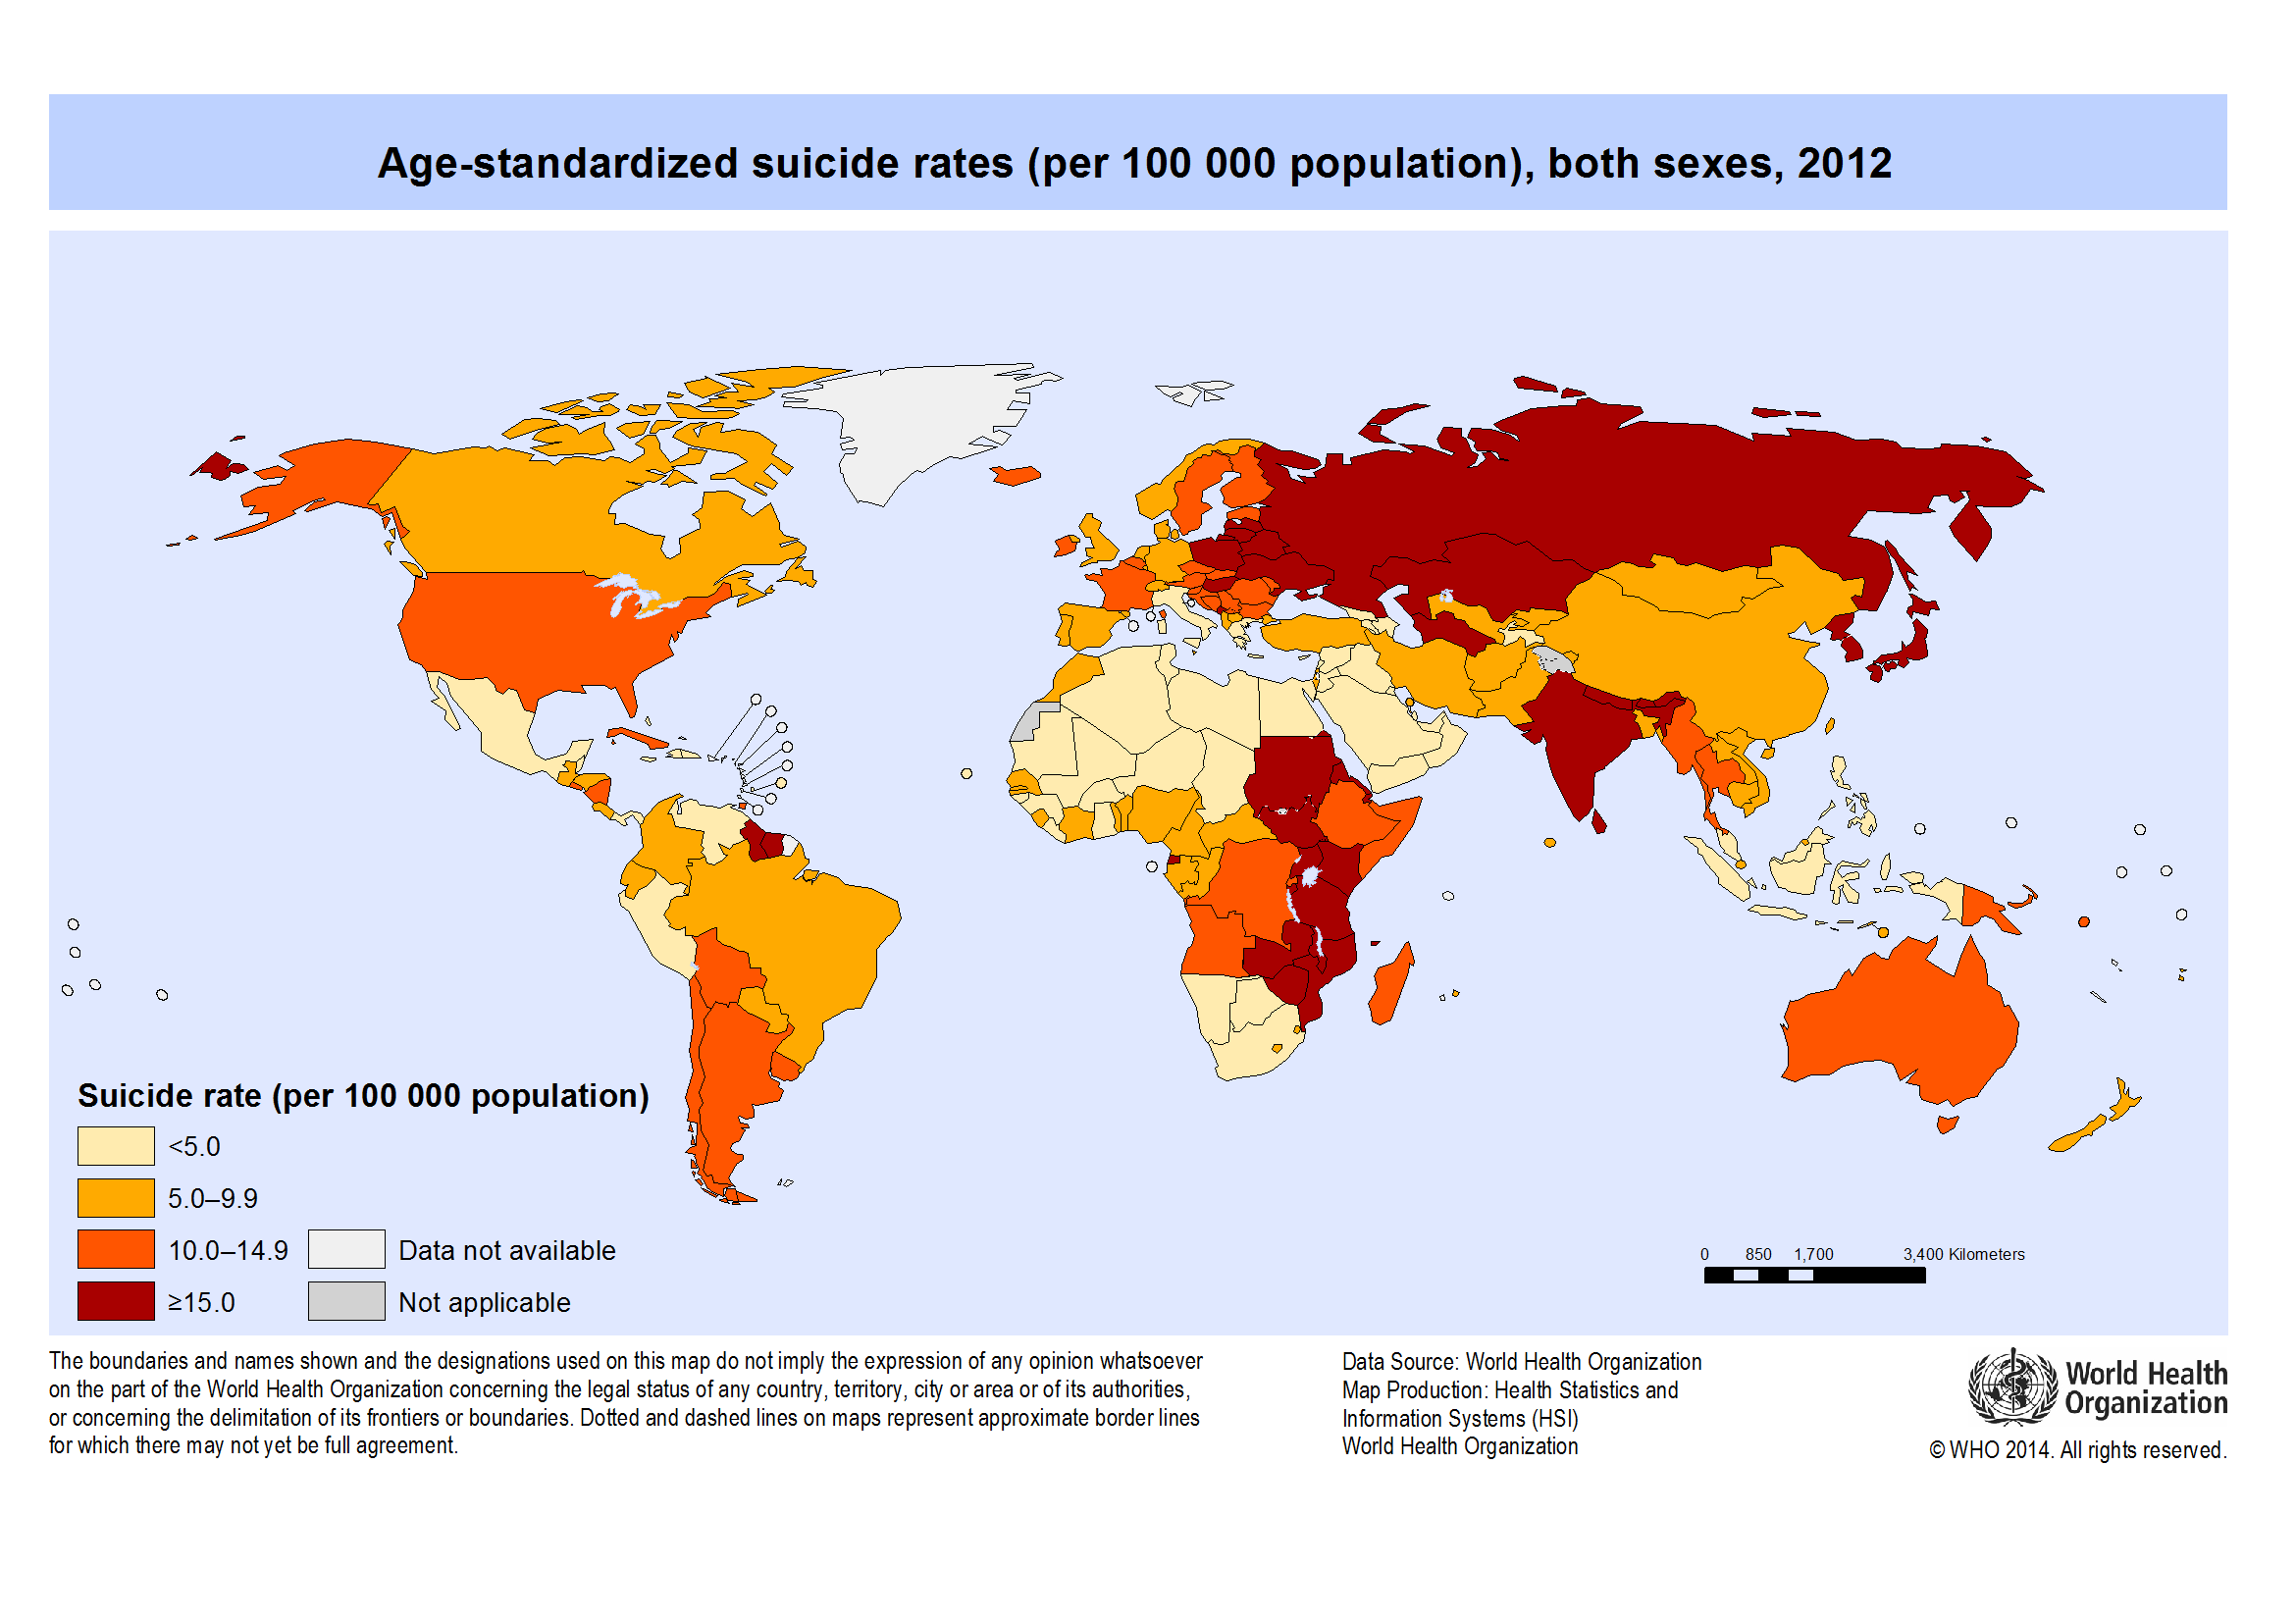
Suicide rates per 100,000 citizens. Data: World Health Organisation, 2016
Social positions matter… a lot!
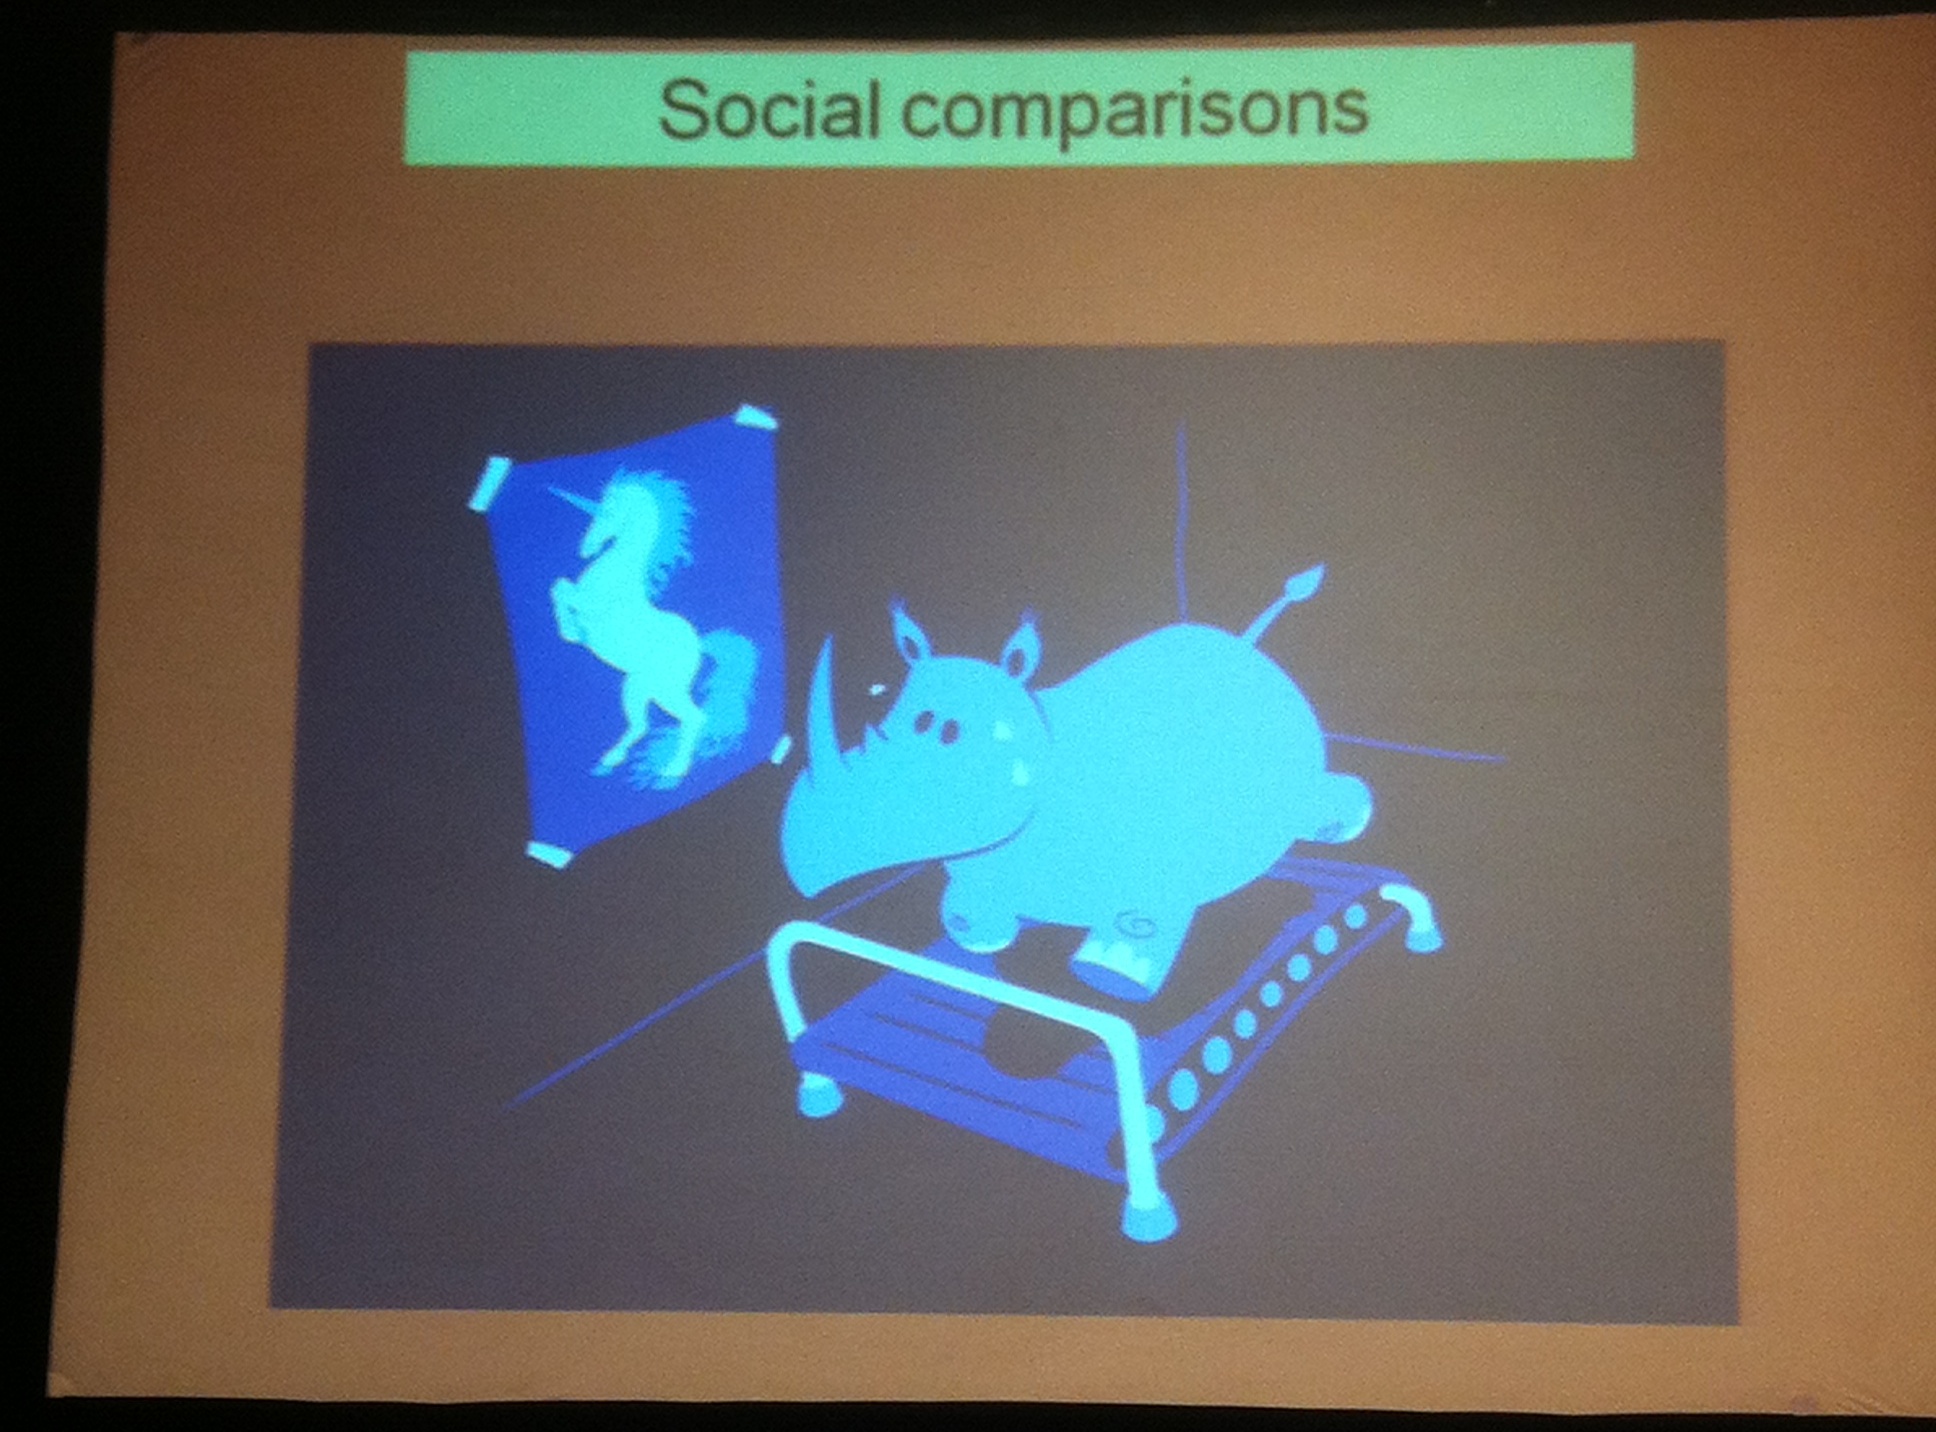
But is there any correlation between happiness levels in society and the suicide? Wiking suggests that there could be a link. He claims that it is more difficult to be unhappy in a happy society. Imagine that Stine is unemployed and that she has had trouble in finding a job for some months. At the same time, most of her friends have great jobs, and excitedly tell her about their promotions or new cool projects when they meet for drinks together. Sounds sad, right? Now imagine the case of Jaime. He has also been looking for a job some time, but some of his friends are in the same boat. When they meet up, they exchange funny stories about failed job applications, or share tips on how to land a dream job.
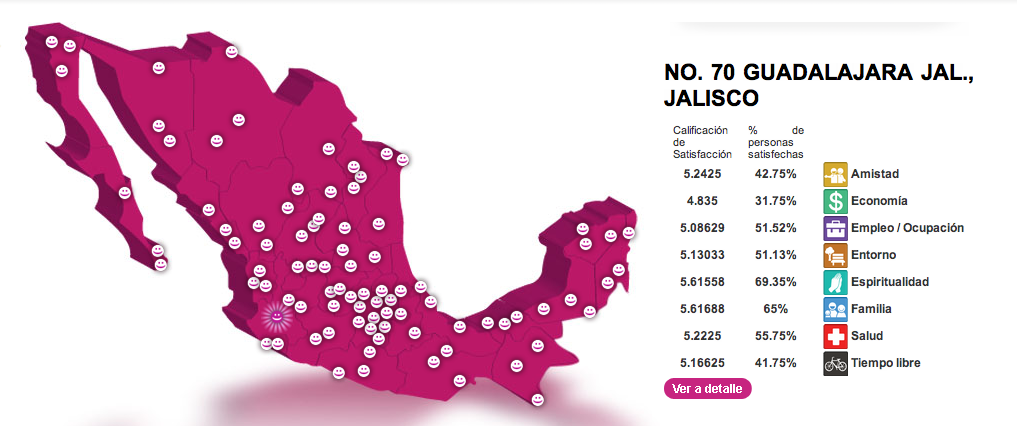
All things equal, Jaime will likely be happier than Stine. Our peer group, and the people who we compare to, matter for how we feel. Hence, it’s tougher to be unhappy in a country like Denmark, which scores a 7.526 in the World Happiness Report, than say in Spain, which scores 6.361. Our social position counts!
Wiking shares a couple of interesting experiments that reinforce that feeling. For instance, tests with social media show that when people are not exposed to other people’s seemingly perfect online lives for a week, happiness rates go up. Similarly, imagine asking hundred people if they’d rather earn €50,000 when everybody else earns half that amount, or €100,00 when everybody earns double. Typically, around 50% would prefer to earn less in absolute terms, but be richer than others.
Summer, a time of darkness
But one of the most shocking pieces of evidence are the quotes from depressed people. Contrasting what you might think, it is not Christmas that is the most difficult of the time for lonely people. In the survey that Wiking cites, spring and summer are worse: “Summer is a nightmare.” Everybody is sitting in parks, holding picknicks and barbecues with friends. For lonely people, this is the hardest time of the year. Other’s people happiness can generate a lot of unhappiness. And the impact of loneliness or happiness inequality is likely a lot bigger than the economic inequality.
Happiness also has a dark side, and summer may be a time of darkness. That truth is worth taking into account when we are thinking about happiness and public policies shaping quality of life.