Category Archives: State/policy

We have to talk about suicide

800,000 people. That’s the number of people who die through suicide each year. And 25 times more, 20,000,000 people, make an attempt to end their life. To put the number in perspective: it is as if all of Amsterdam disappeared, or as if all of Mexico City made an attempt in a year.

Contrary to the belief of some, suicide is not only a problem in developed Western countries. It is a global problem: World Health Organization data for 2016 shows that four fifths of suicides occurred in low or middle income countries. We have to talk about suicide, and 10 September – world suicide prevention day – is a good moment to start.

Happiness thus affects many people, and is the second cause of death for 15-29 year olds. But what can we do to prevent suicide?

I am not a psychologist, and to anybody who truly does not see a purpose to be alive I would above all recommend to seek immediate professional help (and to be clear, this blog does not offer professional help). In many countries, there are suicide prevention hotlines you can call when in crisis. Wikipedia lists them here.

What to do when you have thoughts about suicide

For less acute cases, there are a few things that can be done (partially based on the tips of the Dutch suicide prevention hotline 113:

  • Seek professional help. Get help from a professional therapist to tackle the problems you are facing.
  • Talk to friends or family, or write down your worries. If you express some of the thoughts that are bothering you, their weight is already smaller.
  • Get a daily routine. Make sure you sleep enough and eat in right amounts. Go outside for a walk, or exercise: fresh air and movement already give a boost to the hormones regulating how you feel.
  • See life in perspective. Moments of happiness pass by, but the same is true for moments of unhappiness. The dark side is a part of life.
  • Show gratitude for the good things. Pay attention to and appreciate the small and beautiful things that happen: rays of sunlight on your skin, a nice coffee, a smiling person on the street. You can even consider the ‘three good things‘ practice and start writing down positive events during your day for at least a few weeks.
Image found on Up North Parent: https://www.upnorthparent.com/the-hope-squad-suicide-prevention-awareness-month-resources/

Image found on Up North Parent: https://www.upnorthparent.com/the-hope-squad-suicide-prevention-awareness-month-resources/

What to do to help someone who is down

Suicide and suicidal thoughts are a social issue. What can we do – as individuals – to reduce this source of suffering around us?

  • Speak up and offer help. When you suspect that someone feels lonely and a burden to people, and is not afraid to die, reach out. Talk about the problems they are facing. And not only in autmn, winter or Christmas time: summer can also be a time of darkness.
  • Talk about suicide. According to the Dutch suicide prevention hotline, there is no need to shun the subject. In their experience, talking about suicide does not result in a suicide attempt. Youth could be an exception though: if they talk about suicide openly, this could influence behaviour.
  • Encourage the person to get professional help. Support them in reaching out to professionals.
  • Take care of yourself. Don’t make yourself responsible for all the suffering you see. Use your own support network to express your own feelings.

Equip people to face the ups and downs in life 

As a society, there is still a lot what we can do to improve suicide prevention: continue breaking the taboo, train doctors and other health care professionals in recognising and treating suicidal thoughts and depression, and reduce access to tools used for suicide.

There is more that can be done to strengthen mental health and build resilience. Depression and schizophrenia are said to account for 60% of all suicides. Schizophrenia is a complex disorder, and there is no easy cure for depression. Many cases are inappropriately treated or not treated at all.

As societies grow richer and people live longer, more investment needs to be made to better understand how depression can be prevented and treated. It can start with changes in education: increase emphasis on life skills and happiness at schools, to help people face the ups and downs in life. Happiness education may be a factor that helps to prevent suicide.


Do you have suicidal thoughts? Please, please, please, reach to a suicide crisis line. Find an overview here: https://en.wikipedia.org/wiki/List_of_suicide_crisis_lines 

Netherlands: wellbeing is more than wealth, new indicator shows

One of the Dutch traditions in May is ‘Woensdag Gehaktdag’ (a term so nice I won’t translate it). Every year, on the third Wednesday of May, the government justifies how it has implemented the budget in the last year, and the day the opposition fiercely criticises any misallocated cents.

Last week, however, Woensdag Gehaktdag saw an innovation: it saw the presentation of the first annual Monitor Broad Wellbeing. As I wrote before, this new indicator has been instigated by a parliamentary committee requesting a better toolset to evaluate how the Netherlands is doing in a broader sense than only economic indicators. Prepared by the statistics agency in cooperation with the planning agencies (for which my home country has a passion), the Monitor evaluates quality of life in three ways:

  • wellbeing here and now (how are we doing in the Netherlands, today)
  • wellbeing later (how do our choices today affect the future population of the Netherlands)
  • wellbeing elsewhere (how do our choices affect wellbeing elsewhere)

Throw in a mix of economic, social, environmental, trade and a few extra indicators, and you get a detailed picture of what wellbeing looks like. Where data is available, the Dutch performance is also compared with other EU countries.

A high quality of life, but…

So, how is our broad wellbeing? The conclusions of the report are as follows:

  • Overall, the Netherlands has a high level of quality of life. Many indicators show a positive trend over the last eight years, or a positive change with the year before. Only three out of 21 indicators were markedly negative: the number of people with obesity, satisfaction with free time, and size of nature areas.
  • Nonetheless, the figures aren’t equal. Some groups report lower scores: women, some ago groups (below 25 and 55-65), those with low education levels, and migrants.
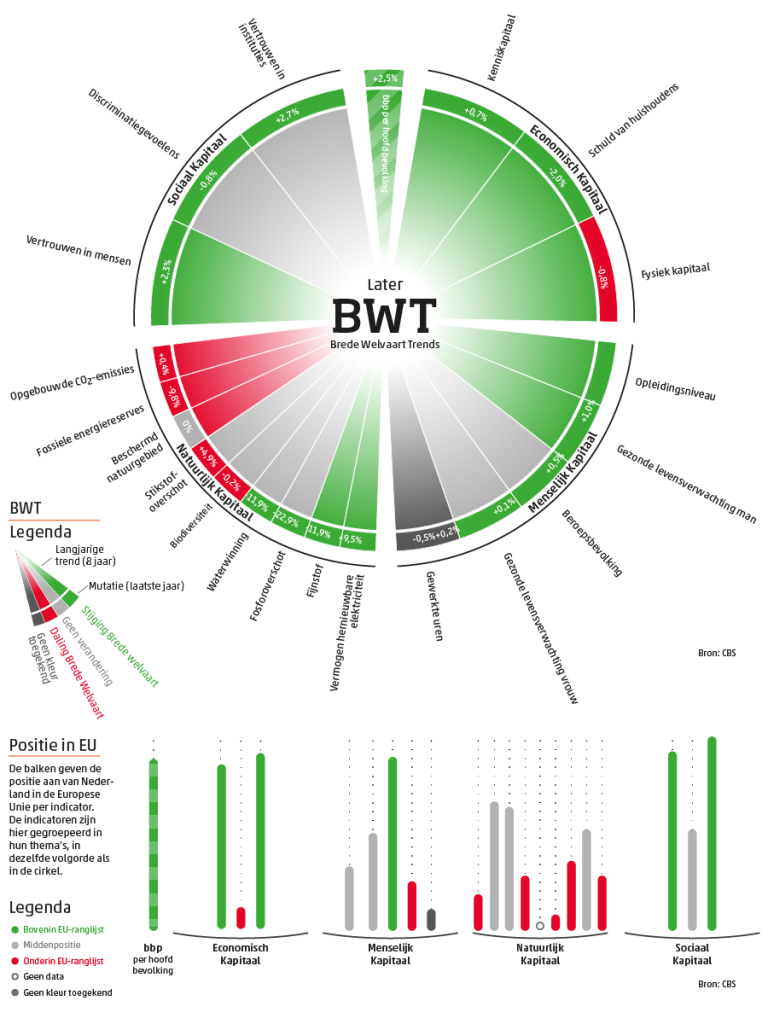
  • Here’s the crux: wellbeing scores are clearly higher in the here and now then they are in the future and for the impact on elsewhere. Indicators concerning the future that post lower scores are primarily the environmental ones: CO2 and nitrogen emissions, fossil energy reserves, and biodiversity. Possibly, policy changes may see improvement here in the future, as energy is becoming cleaner and the Netherlands is due to stop all domestic gas production. However, the Netherlands large agro-food business has a massive and unsustainable footprint. You don’t directly see these negative externalities in simple indicators like GDP – a clear example of the value of the Monitor.
  • Another tricky piece is that current wellbeing is also connected with a negative impact in third countries. The Netherlands has a large carbon footprint and imports resources and biomass from elsewhere, including from least developed countries (LDCs). That means that natural capital is moved from those countries.
Broad Wellbeing Monitor, 'Later'. Source: Dutch Statistics Agency

Broad Wellbeing Monitor, ‘Later’. Source: Dutch Statistics Agency. Key: the graph evaluates the impact on wellbeing later across four categories: economic, human, natural, and social capital. Green/red represents positive/negative 8-year trends or 1-year net changes. The lower part of the graph shows how the Netherlands stand compared to fellow EU countries.

Back to politics

The report is a new annual feature, and should become a high-profile publication with an impact on policy formulation. For that, we go back from the statistics agency to politics, to the MPs and the cabinet we have mandated to make choices for us. This Wednesday will see the Parliament evaluate the government’s performance in a plenary debate, and MPs can use findings of the report to encourage the government to reshape their priorities. In this way, they can make the Netherlands a happier place, not only now, but also later and elsewhere.


A practical study of happiness in Turkey

What does happiness look like in Turkey?

That’s the main question I dived in during a few days in Istanbul two weeks ago, as I spoke at a conference on Determining the Happiness Map.

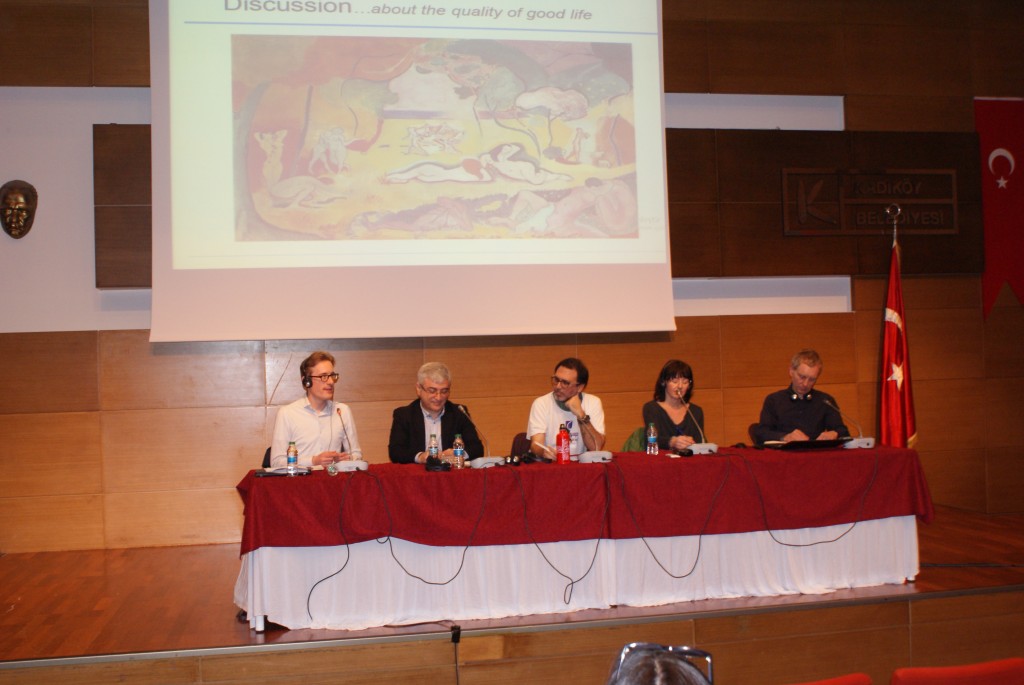
At the conference, hosted by Tüses and Kadıköy municipality, I spoke alongside professor Erhan Dogan (Marmara University Istanbul), Ragnhild Bang Nes (Norwegian Public Health Institute and Oslo University), and Jochen Dallmer (University of Kassel).

Happiness in Turkey

It’s a funny idea to have researchers from cold Northern countries like Norway, Germany and Netherlands come to Turkey to speak about happiness. Many of our chats on happiness focused on the relevance of good weather, tasty food and the street life culture for happiness. While all of those are present in Mediterranean Istanbul, they’re not factors that North-West Europe is known for.

That factor highlighted one of the interesting elements we came to discuss: happiness and quality of life are not the same. While Turkey may have a warmer temperature and a Mediterranean cuisine on offer, some of the key features that contribute to quality of life are less prominent. Norwegians may or may not enjoy themselves more than Turks, but perform well on loads of factors that matter: high incomes, a strong collective social support mechanism, and personal freedom.

How much work do we need to do in life?

A few takeaways from the conference:

  • Turkey’s level has increased over the years. In the 2017 World Happiness Report, Turkey scored about 0.3 points higher (for 2014-2016, compared to 2005-2007). According to prof. Dogan, the factors of GDP and social support are most prominent in explaining the level of quality of life. In that matter, Turkey is quite similar to many other countries. To the contrary, only a relatively small part of the happiness level is explained by generosity. Correlation of course does not equal causation, and there is no direct causal relation, but nonetheless there might be a case to promote generosity!
  • In Norway, the qualify of life is high, resulting in a 1st spot in the World Happiness Report for 2017 (though it was overtaken by Finland in the 2018 edition). But that doesn’t mean all is well. According to Bang Nes, suicide rates in Norway stand at around 11 per 100,000, almost triple the 4 per 100,000 in Turkey. At the Public Health Institute where she works, efforts are made to better understand how people live longer and healthier lives. Better data on happiness and mental health are collected, in order to guide public policy.
  • My third fellow speaker, Jochen Dallmer, looked at the German public debate on quality of life, and especially the role of sustainability. His PhD research is about a complicated question. We know that we should change our lifestyles to get back in the boundaries of the single planet we have. Happiness now is often associated with hedonic pleasures. Could an ascetic lifestyle provide happiness? He also posed another very un-German question: how much work do we need to do in life? And finally, he spoke about the German quality of life data collection, which he felt mainly conveyed high quality/standards.

DSC03590

My own 20 minutes of fame: happiness in the Netherlands and Poland

  • Finally, my own 20 minutes of fame were dedicated to the development of happiness levels in Poland and the Netherlands over the last 25 years. Dutch happiness level stayed broadly stable, and slowly a more active public debate on well-being policies is emerging. Until the elections of this month, the municipality of Schagen had a Councillor for Happiness (with Finance as his primary portfolio). And similar to the Norwegian and German efforts, a new Broad Wellbeing Monitor mapping happiness is being shaped after a hesitant start.
  • Poland has seen massive transformations since the 1990s, and also the domain of happiness has not been left untouched. Even with social ineqaulity rising, happiness levels icnreased, likely in connection with tremendous economic growth. But also Poland shows awareness that there’s more than work and GDP. The Pracuję bo lubię (‘I work because I like it) project is one example taking happiness as inspiration.

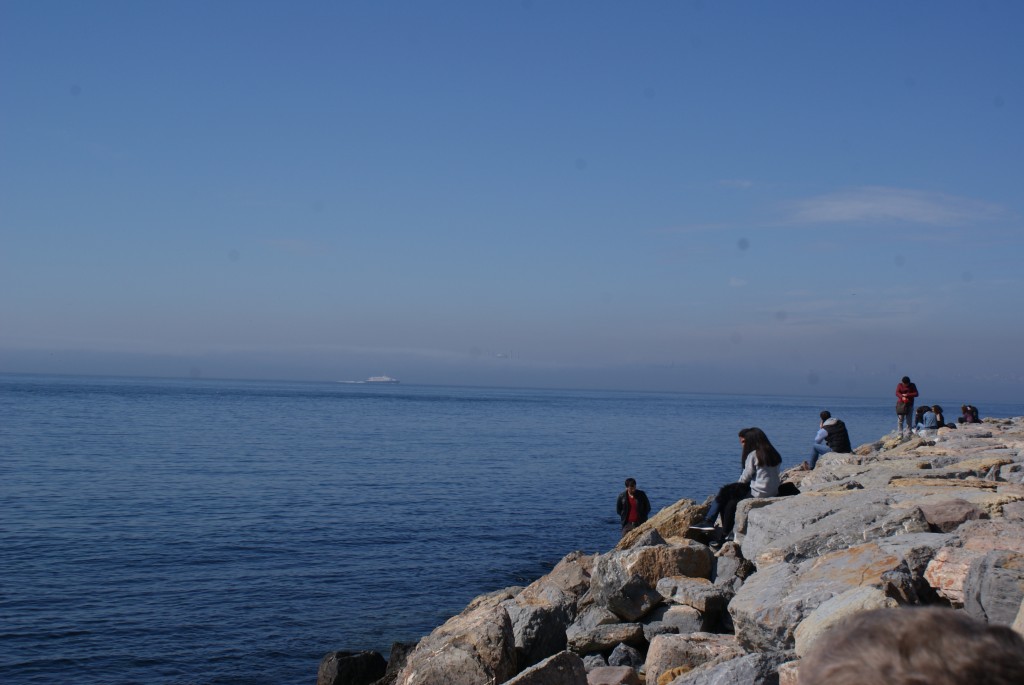
And my own happiest moment in Turkey? A lost Sunday afternoon hour in company of old and new friends, spent basking in the sunlight with a view on the sea of Marmara.

DSC03648

On this International Day of Happiness, learn how Finns pay attention to the right things

Happy International Day of Happiness!

The International Day of Happiness must be my favourite day of the year. It is a recent invention, and only celebrates its fifth anniversary today.

Like every international day, it acts as a reminder to pay attention to the right things. To be aware of what makes us happy, and cut away some of the things that don’t. There are plenty of sources of inspiration that could help make small moments of happiness happen, like on HappyActs or Action for Happiness. Often it’s very simple: say thank you or smile to someone, take a walk in nature, or do a (Random) Act of Kindness.

Source: #HappyActs calendar

Source: #HappyActs calendar, www.happyacts.org


World Happiness Report

The release of the World Happiness Report is now a regular fixture on the calendar. This year, there is a new number one: Finland. It is a sign there is a lot of space at the top: the last few editions also saw Norway, Denmark and Switzerland coming first. (The authors explain that this is due to very small differences in happiness levels among these countries. Next year it could be any of those – or Iceland – again).

All these countries share high performance across the board on factors that strongly correlate with happiness: a well-developed economy, social support, a good health system, personal freedom, trust in public society, and high levels of generosity.

Having said that, there are a couple of things that are particularly interesting in the Finnish case, and that might have helped to build a lead over its competitors for first place.

  • Education in Finland is of high quality. Finnish teachers are highly respected and qualified (a master’s diploma’s are required), and the country scores extremely well in international comparisons.
  • Nature matters. Finland is a scarcely populated country. Having nature makes it easy to get away from daily distractions. It also facilitates an active lifestyle favouring happiness (this is also a factor that it has in common with other high performers, like Norway and Switzerland). Some Finns take this to the extreme though: the practice of winter bathing is popular in some circles. It goes like this: cut a hole in a frozen lake, dip in for a minute or so, and then run for the sauna to warm up.
  • Sisu‘, a concept close to hearts of Finns that helps to keep going. Many Finnish people believe in the idea of ‘sisu’, which means something like grit, resilience or determination. This attitude helps to overcome difficulties, be it a long cold winter or adverse events in life.

Does that mean that everything is perfect in Finland, or any of the other top five countries for that matter. Of course not – paradise on Earth does not exist. But Finland is a state that takes care of education, offers a natural environment that promotes an active life style, and has a cultural strong attachment to grit. These factors all help in the pursuit of happiness. If happiness is about paying attention to the right things, the Finns probably are doing a great job.

Determining the world’s happiness map: from ‘mutluluk’ to ‘shiawase’

The poster below is for a conference I’ll be speaking at in Istanbul on Friday 9 March (join if you’re around!) Whether you can join or not, I thought the design is so nice it is worth sharing.

The conference, hosted by the Social, Economic and Political Research Foundation of Turkey (TÜSES) and Kadıköy municipality, aims to ‘determine the happiness map’. Speakers from Turkey, Norway and Germany, as well as your truly at For A State of Happiness, will share their knowledge. But before the conference day even starts, the organisers’ poster already make quite a trip around the world.

The poster displays the words of happiness in a few languages. But which languages are these, and what is the original meaning of those words? Admittedly I didn’t get all of them right straight away, but with the help of Google and wiktionary I quite far.

Scroll lower for a crash course in the etymology of happiness.

Istanbul happiness conference

Happiness (English)

Bonheur (French)

Glück (German), geluk (Dutch), lykke (Norwegian)

All different and all the same! Interestingly, all the words for happiness in these Germanic languages share a common etymological origin. As Darrin McMahon writes in his history of the philosophy of happiness, Happiness: A History, it doesn’t even stop there:

“It is a striking fact that in every Indo-European language, without exception, going all the way back to ancient Greek, the word for happiness is a cognate with the word for luck. Hap is the Old Norse and Old English root of happiness, and it just means luck or chance, as did the Old French heur, giving us bonheur, good fortune or happiness. German gives us the word Gluck, which to this day means both happiness and chance.”


Felicidad (Spanish), felicidade (Portuguese)

Both in Spanish and Portuguese (as well as in the Italian felicità), the words for happiness have a root in the Latin word ‘felix’. ‘Felix’ could also mean ‘fertile’. The Romans venerated a goddess called ‘Felicitas‘, which among others represented fertility (although in modern times, people with children tend to see slightly lower happiness rates).

But felicitas meant more than fertility: sharing the meaning of the Germanic terms above, felicitas also means happiness in the sense of ‘good luck’.


Mutluluk (Turkish)

A quick search suggest that the Turkish word ‘mutluluk‘ combine ‘mutlu’, happy with ‘luk’, a suffix to add -ness. ‘Mutlu’ itself is also a given name. Very economically, it’s antonym ‘mutusz’ means sad.


شادی (Shadi; Farsi)

In Farsi, finally, happiness is ‘shadi’. I can’t find too much about it, apart from that is also a name!


Szczęście (Polish)

If this description and Google Translate don’t deceive me, the  Polish word for happiness dates back to the 14th century and originates in a Slavic dialect. It seems to combine the prefix sъ- (‘good’) with čęstь (‘part’), to render something like ‘good part’ or ‘successful endeavour’. Good luck pronouncing the ‘szcz’ bit though!


幸せ shiawase (Japanese)

In Japanese, the word for happiness is a combination of two characters.

, says Wiktionary is an old Japanese verb ‘su’, meaning to “to do, to make something be a certain way”. It is complemented by  合わす (awasu, “to join together, to fit together”, though the last part is often simply written as .

Combined, that makes “to put together well; to work together well”. That results in meanings like ‘happiness’, ‘good fortune’ or ‘good luck’, circumstances or the flow of events.
But the most eloquent rendition is “a moment when circumstances come together; fate, opportunity”. Isn’t that a beautiful definition of happiness?

The robots are coming. What purpose do we have left?

A life without purpose is no life all.

Our purpose – a key element of a happy and fulfilling life – could be radically overturned by the rise of robots. Automation and artificial intelligence, sometimes referred to as the Fourth Industrial Revolution, are threatening work and the economy as we know it. With that, even our happiness levels could be at risk.

The robots are coming

A seminal study on the future of employment by Frey and Osborne of 2013 put the figure of US jobs that could be automated by the early 2030s at around 47%. Imagining that about 1 in 2 employees lose their jobs is massive, but it is an average. For some sectors, like truck drivers or cab drivers, the figures are 70% or higher. If self-driving cars deliver on their promise, they will drastically reduce, or even eliminate, deathly car accidents. They will also radically cut employment in a sector that now represents about 3% of the US economy, and offers people with low education access to a middle-class lifestyle.

The gastronomy sector is another example. In a few years, you can order your pizza capricciosa online, and have it delivered home without any human intervention (we’re already almost there, though we still need a few humans). The dough could be prepared by one robot, the stuffing and sauces by a second, a third could bake it, and it could be delivered to your doorstep by driverless vehicle. Hygiene and efficiency would increase. For a capitalist, it is great: robots can work 24/7, without asking a salary, requesting additional training, getting bored, or going on strike.

White collar jobs are also at risk

But it’s not only blue collar jobs that can lose out. Also part of complicated jobs, like lawyers, accountants or radiologists can be automated. Again, their performance can be better than of humans. A well-programmed (or ‘trained’, through machine learning), robot accountant does not make the mistakes a human makes. A robot radiologist sees more cases during its training that a human during their entire career, and scores better in its diagnoses. These are just some examples: robots might also threaten your job, because humans can be beaten in every repetitive task.

Dramatic social effects

All these developments have massive social and economic effects. If robots take over so much of the current work, what will we do? Can we create new jobs for the 47%? Or will only be half the population be able to be employed? The demand-and-supply laws would posit that salaries would go down. Only those who control robots, the new means of production, would earn good salaries. Inequality would massively increase. This development is already visible in places like San Francisco. A four-person family with an income below $105,00o is now considered poor.

Maybe the entire economy would collapse. If only few people work and earn salaries, who can afford to consume of all products and services that robots produce? Henry Ford’s production line only started to take off when he realised that he needed to pay his staff enough to buy his T-Fords. Supply is nowhere without demand.

A new social contract?

Many in the tech industry, from Elon Musk to Mark Zuckerberg spoke out on basic income as a tool to protect those who lose out. In an interview last year, Bill Gates advocated a robot tax: “The human worker who does, say, $50,000 worth of work in a factory has his income taxed and you get income tax, social security tax, all those things. If a robot comes in to do the same thing, you’d think that we’d tax the robot at a similar level”. Policy makers, such as San Francisco counsellor Jane Kim, have started to think what it could look like. Basic income might be part of the new social contract in a robot-driven economy – who knows?

What is our purpose?

At the moment, we have many more questions than answers. We know robots can do many parts of our jobs, and that some sectors are destined for radical transformation. But we don’t know what comes next. When coal mines in Western countries were closed in the 1970s and 1980s, nobody could tell coal miners not to worry – we didn’t know yet that their children and grand-children could make a living as social media managers or YouTubers.

Similarly, the jobs that will be needed in the 2030s may not exist yet. At the same time, there are a few things that can give us hope. Coding is safe – robots cannot programme themselves (yet?). Social skills and social relations will remain important. And while robots are great in performing repetitive actions in situations they have seen before, they cannot (yet?) deal with completely new situations and decide what to do.

So, there are at least two avenues to find our purpose: one is to do the non-routine, creative work that is hard to automate (some creativity can be automated though – robots can create music and paintings). Another thing we can imagine is living the life as in Keynes vision – with a 15 hour working week, we can spend so much more time on holidays. There are a few big ifs – firstly, we need to have a new social contracts that allows it. Secondly, we  need to find a raison d’etre, a purpose outside work.

We should hurry to do so. The 2030s are close.

How’s life in 2017? Social divisions result in lower happiness, finds OECD

How’s life?

It’s not only mother or your colleague who’s asking from time to time. Policymakers are interested, too.

The Organisation for Economic Cooperation and Development (OECD) every year comes with thick studies to answer the question. Earlier this month, the 2017 edition was published, mapping how people in OECD countries feel about a bunch of things: jobs, health, safety, life satisfaction, and so on. Altogether, the datasets cover eleven broad indicators of the OECD Better Life Index.

These studies are important. Data is power, and having information on how people feel matters a great deal to making the world a better place. As the OECD says it: it helps achieving well-being for all.

So, how do we feel?

The answer is 6.5.

That is, on a ten-point scale, is the average life satisfaction for 2017, marginally lower than the 6.7 score shown in 2005. The small decline probably results of the interaction of a few steps forward and a few step backwards. For instance:

    • Incomes and earnings went up, by 8% and 7% respectively. But inequality remains strong: 1/3 of people would go in poverty if they had to miss three months of salary.
    • The employment rate went up by 1.3 percentage points, and working hours improved in most countries. But long-term unemployment got worse in half of the countries.
    • Since 2005, the number of smokers reduced from 22% to 18%. But the number of obese people increased from 22% to 24%.
    • Education levels see strong improvements. But voter turnout and trust in government decline in more than half the countries.

Well-being for all

A large part of the 2017 report is dedicated to equality. While debates about inequality are often about wealth and income, the OECD believes that inequality is felt in every area of our lives.

For instance, the richest 20% are advantaged in many well-being indicators:

  • Rich people spent 11 times more time on social activities than poor people
  • The top-20% has 5-fold higher household income than the bottom-20%
  • Life satisfaction is twice as high
  • And poorer people tend die a lot younger: the standard deviation in age at death is 13 years

And as a special section of the report shows, migrants particularly tend to be worse off.

This all matters, because more equal societies tend to be happier ones. While the situation is a bit scattered, there is some correlation between income equality and life satisfaction. In OECD data, the correlation is even stronger when inequality is plotted against the broad well-being indicators.

The American Dream vs Janteloven

Take the examples of the United States and Denmark. If you are successful in life, you can have all the American dream. The US is a ‘winners’ society: it is an extremely rewarding environment to build a business and prove yourself. Income taxes are low, and healthcare and social security provisions are bare. At the level of society, the payoff in happiness is not too high. America ranks 14th in the World Happiness Report, with an average below 7 out of 10. Not that great, one might say.

Denmark, to the contrary, is a society that also wants to make ‘losers’ thrive. It offers a strong social security system, that’s even a factor contributing to high happiness. Denmark also wants to offer a good life to people that ‘fail’ in life. Indicative for the Danish way of looking at success is the ‘Janteloven’, or Law of Jante. Janteloven is a list of ten rules that basically boil down to: don’t imagine you’re someone, we’re all the same, and you’re not worth anything. Though, depressingly, the sense of equality it instills helps contributing to a balanced, and happy, society. Denmark often ranks on top of the happiness list, finding itself back at 2 in 2017.

Data to learn from

Either way, Americans and Denmark are both as they are. Even cultural differences in our thinking about inequality could affect our happiness. Beyond books and articles about hygge, reports like the OECD one help to learn from each other. It feels naive to write this down, but the United States can become a little bit more like Denmark. And among the wealth of data, Denmark can also find some inspiration in how people in the US pursue happiness.

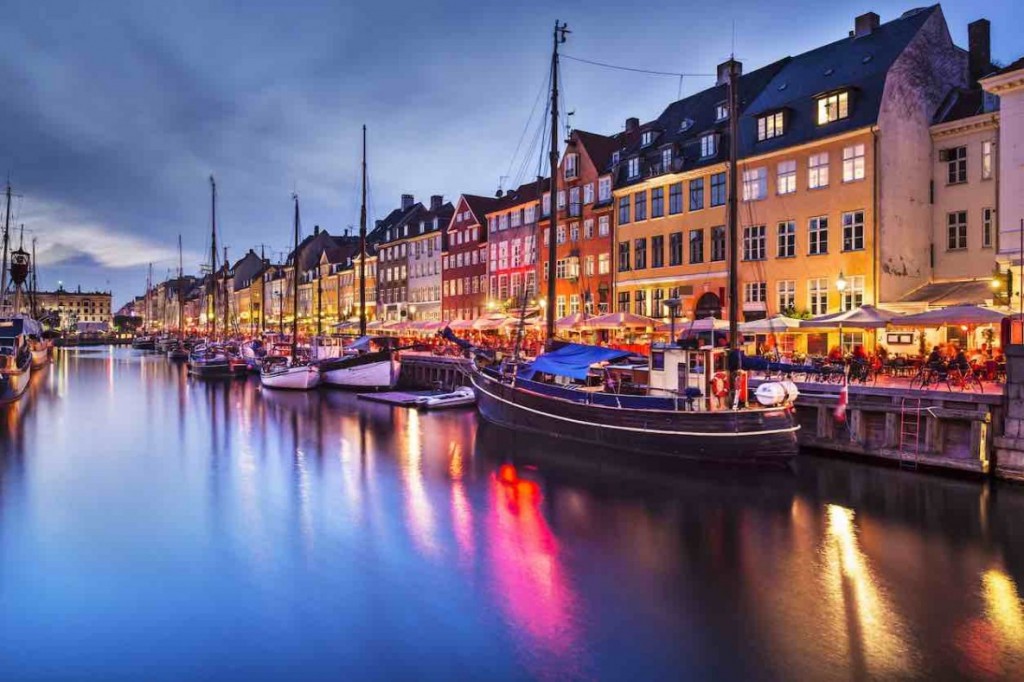
View of Nyhavn, Copenhagen.

View of Nyhavn, Copenhagen.

Basic income, revisited: the Finns are on it!

Until recently, I lived and worked in Belgium, and benefitted from a benevolent state taking care of me. I received lunch vouchers for around €100 to €150 a month. Plus ‘ecological vouchers’ for organic products or train travel. Plus ‘sports and culture’ vouchers, for, well, sports and culture. My monthly contribution to the public insurance fund came in at a very modest €8,00, and my own contribution for most treatments was fairly low. Had I lost my job, there would be an expansive social security system where I could get support. Sounds good, doesn’t it?

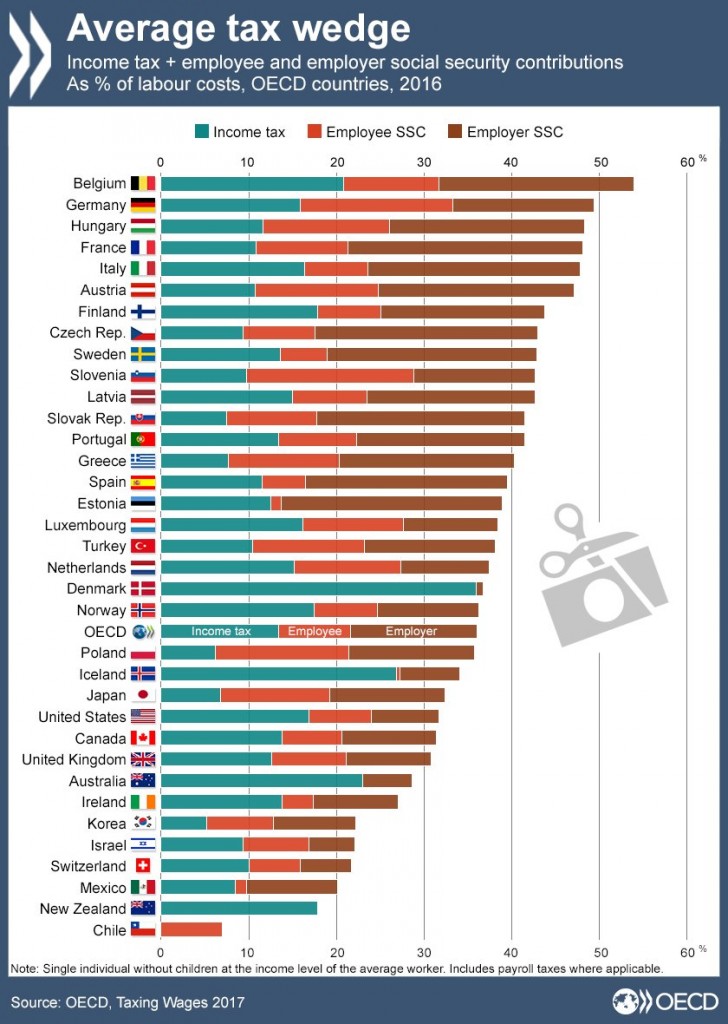
Well, I spent my time in one of the most heavily taxed countries of the world. Relatedly, Belgium ranks on top of the list across the OECD as for the labour costs – income tax, and employees and employers’ social security contributions. Over half of the wage costs of a Belgian employer account for income tax and social security contributions. Or in other words: it costs over €4,000 to have an employee with a take home pay of €2,000.

Tax wedges in OECD countries. Source: OECD

Tax wedges in OECD countries. Source: OECD

Basic income, revisited

Even if you agree with the noble goals, and despite the correlation between high taxes and happiness, wouldn’t it be a lot better to remove this money pumping function of the state? If a tax reform increased  my net salary by the same amount, I’d have happily foregone all my vouchers and started paying an amount closer to the real cost of my insurance. Sweet and simple!

Last year I already wrote about the possibility of using basic income as a tool to simplify social spending. At the time – just after the Swiss voted ‘no’ in a referendum on the subject – I saw the possibility to get rid of series of tax breaks and charges that have little more effect than creating employment for tax collectors on the one side and tax consultants on the other.

Two things made me revisit the issue. Firstly, the policy discussion on basic income has advanced: more studies have been produced, and Finland’s experiment is underway. Secondly, we are getting a better picture on how basic income can help us solving social problems around globalisation and automation (the robots are coming, and they may give us the cash we need!). Let me take the second issue in a later piece, and look at the policy discussion now.

The Finnish experiment

Finland’s national experiment with basic income launched in January 2017, and contrary to other recent tests has nationwide coverage. 2000 selected Finns now get a monthly sum of €560 – no questions asked. That’s a modest amount, compared to the €2,500 national average wage. It’s not universal basic income per se, though. The participants are all unemployed; typical employees and billionaires don’t get basic income. Kela, the Finnish social security body that organises the experiments, deducts basic income from other social spending, so that basic income mostly replaces existing tools. Despite these limits in scope, the basic income is fully unconditional: participants are free to spend the money any way they like.

While Kela is clear that conclusions will only be reported after the end of the experiment, initial feedback confirms earlier anecdotal evidence that basic income increases the sense of freedom and happiness. Vice went to speak to Juha Järvinen, an artist who feels basic income allows him to focus on what he enjoys: creating the shaman drums that he sells. For Järvinen, the money is not the main advantage of the experiment: “you need to be a magician to survive” on €560 a month in Finland. Instead, it’s the fact that the employment office is not at his back all the time that gives him a sense of liberation. The basic income provides a first basis that makes it easier to undertake the project he likes. He recognises that with this level of spending a beneficiary couldn’t simply be lazy and do nothing, as some adversaries of basic income fear.

Left-wing and right-wing basic income

The Finnish government is a centre-right one, and this is visible in the design of the experiment. Typically, many proponents of basic income are centre-left, focusing on the benefits basic income offers to personal freedom and development, and quality of life. From a left-wing perspective, basic income is about citizens’ rights and distribution of state means. Basic income could then be a tool to ensure that citizens have equal possibilities, and that people of poorer or minority groups are not worse off.

The centre-right perspective would rather emphasise simplification and reduction of state spending. Basic income could replace up to 100 tax incentives in the Finnish case. This is also a key condition to ensure that basic income remains affordable, they argue.

Can we pay it?

That begs the critical question: can we afford basic income? The low Finnish basic income is set up with affordability in mind. It’s not an easy question. The answer of the advocacy group, the Basic Income Earth Network (BIEN), boils down to ‘it depends‘: if we narrowly redistribute existing benefits, it could work. However, if we maintain all existing benefits and then add a broader basic income for everybody to live comfortable, governments will struggle to find the means.

Is basic income better than current social spending?

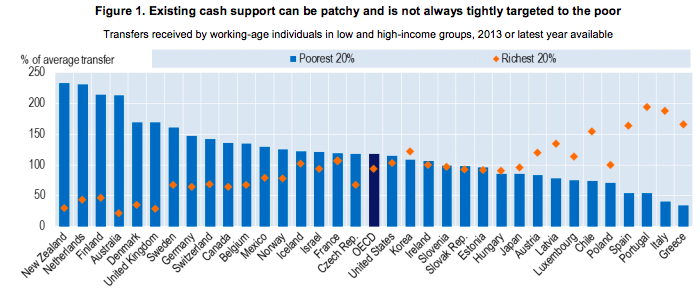
The Organisation for Economic Cooperation and Development (OECD) weighed into the debate via a study outlining a slightly different question: does basic income reduce poverty and increase equality? The study started with the observation that social expenditure is targeted in wildly different ways. As of 2013, the 20% richest in the average OECD country benefitted only marginally less from cash transfers than the 20% poorest. In most countries, the poor obviously benefitted more from transfers than the rich. But in a few countries, particular subsidies worked out in a net transfer from everybody else to the rich, including Greece, Italy, Poland, and Portugal.

Beneficiaries of cash transfers in OECD countries, 2013. Source: OECD

Beneficiaries of cash transfers in OECD countries, 2013. Source: OECD

So, does basic income do a better job? According to the OECD, it probably doesn’t. If basic income were to be set at the level of current spending –  a narrow basic income – it would remain below the poverty line across all OECD countries, sometimes staying far below. Not surprisingly, if you consider that at present only a share of the population benefits from public spending. As such, basic income would risk distributing from the poor to all. Then, it could draw similar criticism as some education grants do: funds paid for by the baker and the electrician to finance the career investment of the lawyer’s son.

Redistribution from the poor to all

Looking at modeling of how basic income could work in Finland, France, Italy, and the UK, the study finds that a narrow basic income indeed would not reduce poverty. Rather than sharing wealth, the changes in public expenditure would redistribute poverty along different lower-income groups. As such, simply pooling existing benefits and reallocating them as basic income is not the right solution. But there might be other ways – maybe robots could come to rescue? That, however, is a topic for another post. See you later!

The Netherlands: small happy cities in a ‘madly cool country’

The population of the Netherlands is two-faced. When we are among ourselves, we like to complain: about our politicians, the weather, taxes, the healthcare system, declines in fixed jobs, and immigration. In this year’s elections, parties with populist policies won over 25% of the vote.

While we tend to be pessimistic about society as a whole, most people are very satisfied with their own lives. Despite our complaints, the Netherlands is one of the happiest countries of the world. Indeed, when we speak to foreigners, we paint a proud picture of our country. We speak of the Netherlands as a country that is hard-working but not too serious, innovative, well-organised, and with high standards of life. PM Rutte’s daily job is to tell Dutchmen they live in a ‘waanzinnig gaaf land’, which means something as a ‘madly cool country’. A Financial Times feature just before the elections broadly supported the claim.

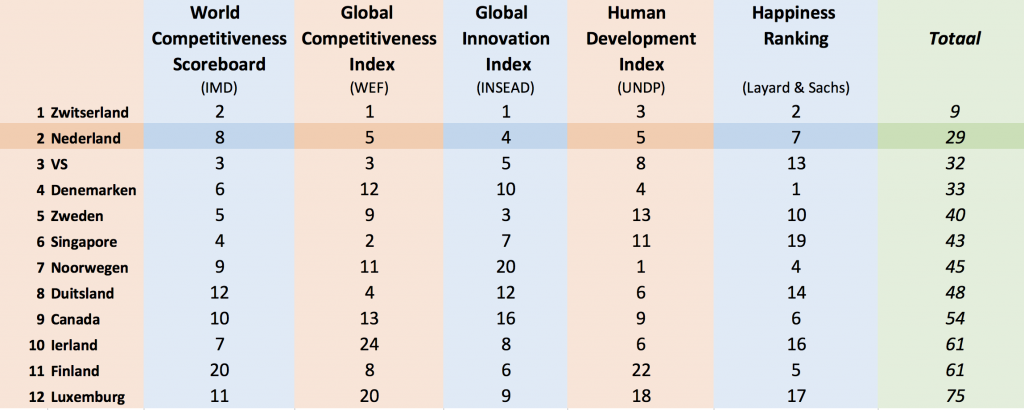
Indeed, if we look at the stats, it is fair to say ‘The Netherlands second’, as the viral video presenting the country to President Trump did this year did. Dutch economist Mathijs Bouman mapped the Netherlands’ performance on a range of indicators, comparing various rankings on competitiveness, innovation and human development. His conclusion? The Netherlands is the best country of the world, second only to… Switzerland. Only when the World Happiness Report was added, the Netherlands jumped over the United States to second place.

The Netherlands second. Source: Mathijs Bouman, http://mathijsbouman.nl/nederland-is-het-beste-land-ter-wereld-op-zwitserland-na/

The Netherlands second. Source: Mathijs Bouman, http://mathijsbouman.nl/nederland-is-het-beste-land-ter-wereld-op-zwitserland-na/

Happiness: the last frontier

With good scores on so many levels, it is time to reach the last frontier: make society even happier. And the Dutch are getting to business: over the last years, society’s happiness and alternative indicators have gained more attention in the Dutch public debate. Last year, the Dutch Parliament supported steps to create a ‘Monitor Broad Well-being’, to better assess quality of life in the Netherlands.

A happiness atlas

Researchers and marketeers are also spending time on the topic. Recently, a study crowned the central Netherlands town of Ede the happiest city of the Netherlands.

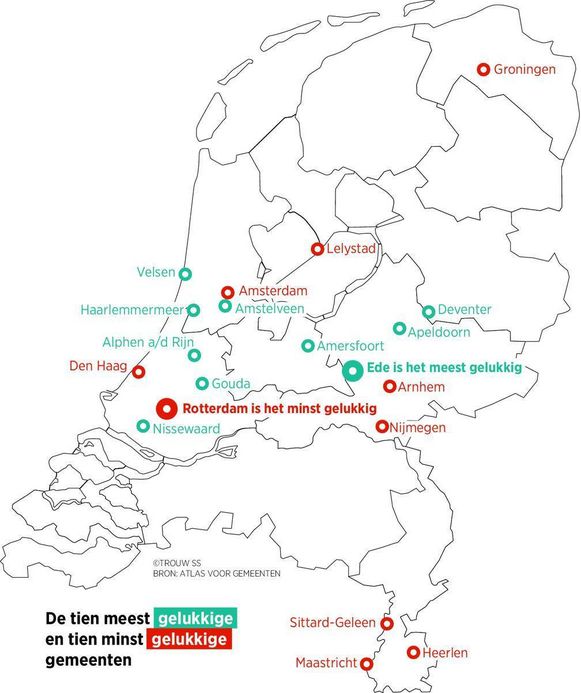
The Atlas of Municipalities, prepared with the support of the Happiness Research Centre of the University of Rotterdam, compared happiness levels in the 50 largest towns. Mid-sized towns like Ede, Apeldoorn and Gouda rank to the top, while most of the larger cities like Groningen, Amsterdam and The Hague are on the bottom of the table. Rotterdam, the second-largest city, even closes the list of 50. The map below outlines the top-10 in turquoise, and the bottom 1o in red.

This map shows cities ranked 1-10 (in turquoise) and 41-50 (in red) in the Atlas of Municipalities. Source: Trouw, based on data of the Atlas. https://www.trouw.nl/home/het-geluk-is-te-vinden-in-een-middelgrote-stad-ede~aeb4553a/

This map shows cities ranked 1-10 (in turquoise) and 41-50 (in red) in the Atlas of Municipalities. Source: Trouw, based on data of the Atlas.
https://www.trouw.nl/home/het-geluk-is-te-vinden-in-een-middelgrote-stad-ede~aeb4553a/

What is happiness, anyway?

Let’s dig in a little bit deeper into what this all means. First of all, what is happiness anyway? For the purposes of the study, it is “the extent to which an individual find satisfaction in their own life as a whole”. ‘Happiness’ is then measured via three metrics: an overall judgement of a respondent’s life satisfaction as a whole, the extent to which one is a happy human being, and the extent to which one felt happy in the last four weeks. Ede overall scored best at this, with 89% of the local population scoring at least an average of 7 out of 10 among the three.

Second, how is Ede different than others? The researchers identified seven factors that account for the differences in happiness levels across Ede and the other cities. These, include the size and composition of the population, the employment rate, health, religion, and the attractiveness of life in the city. That however doesn’t mean that Ede is the only city doing well on those factors, or on happiness. Overall, smaller cities tend to perform better than bigger ones: here, life is less chaotic, while there is more on offer than on the countryside.

Marginal differences

The differences between cities appear quite marginal and probably are not statistically significant. 17 out of the 50-sample score 88 or 89%, no fewer than 42 are in the 85-89% bucket, and even number last Rotterdam houses 82% of happy people. As such, the meaning of being ranked first, second, or even thirtieth, is fairly limited.

Other indices in the Atlas convey this point even more. The happiness index is only an annual theme of the Atlas, which annually compares cities on a range of metrics. Some of these metrics are pooled into indices, for instance mapping ‘attractiveness’ and social-economic performance.

The ‘attractiveness’ index aims to compare how attractive cities are as a place to live for the Dutch population. It looks at factors such as the jobs within range of the city, the share of owned and pre-war homes, distance to nature, and the culinary and cultural offer. The social-economic index, as the name says, looks at elements like employment, the population share on welfare and with low education levels, and the poverty rate.

Both rankings offer a radically different overview than the happiness ranking: ‘Happy’ Ede finds itself back at the 15th place as for its social-economic performance. ‘Unhappy’ Rotterdam is found a more attractive place to live than Ede (respectively 17th and 22nd on the attractiveness index).

Spotting strengths and weaknesses

The takeaway? Indices help to spot cities’ strengths and weaknesses, especially when you dig in the underlying data via the OECD-type dashboard approach the Atlas offers. But different measurements give different results. While it is fun to publish such rankings and see how our cities perform, one cannot a lot of value to small differences or annual movements in the Netherlands. And the key message remains that life in the Netherlands is good. We can be among 82% of happy fellow citizens, or among 89% in Ede. In this sense, the Dutch do live in a ‘madly cool country’, as Prime Minister Rutte said.

The World after GDP

Guano mining at the Chincha island off the Peruvian coast. Source: Wikipedia.

Guano mining at the Chincha island off the Peruvian coast. Source: Wikipedia.

Guano – basically bird dung with an exceptionally high quality as fertiliser – was a highly demanded product. Mainly found on Pacific islands off the coast of Peru it was a popular agricultural fertiliser since the 1840s. From the 1850s, demand sky-rocketed, and competition for guano deposits was fierce. It was guano that was at the basis of the United States imperialist tendencies. The Guano Island act of 1856 allowed US citizens to take control of unclaimed islands.

Why is this relevant, and what does it have to do with GDP?

Guano soon made the people mining it rich. But the environment suffered: it took few decades to exhaust all reservers and leave the islands containing deposits bare. Favouring short-term economic gain over long-term environmental sustainability destroyed the islands.

Guano is just one example, but fits a long human tradition of discovering, using, and then exhausting precious resources, without batting an eye about the environmental consequences – very often driven by the desire to achieve economic growth and increase GDP. But compared to the 1850s, we have a lot better understanding of how these patterns go, and a larger awareness that alternative strategies are possible.

The World Before and During GDP

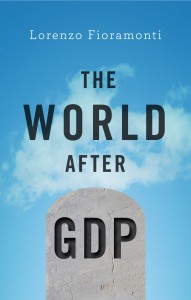
The World After GDP by Lorenzo Fioramonti. Editor: Polity books

The World After GDP by Lorenzo Fioramonti. Editor: Polity books

The World After GDP, a new book by Lorenzo Fioramonti, offers some of thoughts to escape this trap. It starts by the notion that today, with the exceptions of few isolated and traditional populations, human beings above all are consumers. Private consumption is what is at the basis of GDP and keeps economies going.

GDP however has a bit different origin: it started as a tool to help the English king and French sovereigns in the 17th and 18th century determine how much tax their populations could sustain. The modern institution of GDP developed as of the 1930s, when economic Simon Kuznets helped the US administration understand the national income. Over time, GDP evolved from a metric to see the size of the economy to a goal per se.

Revise GDP, but don’t dethrone in favour of another flawed indicator

The beyond GDP argument that Fioramonti also makes has already been widely discussed on this blog. Fioramonti discusses, and welcomes, the many contenders of GDP. He dedicates some attention to the Human Development Index, the OECD’s Better Life Index, Gross National Happiness, the Social Progress Index, and more. He also notes that the criticism has resulted to some top-down changes to GDP, such as statistical revisions to add up the black market to national economy. The change to consider investment in research as a benefit rather than a cost is another example.

The Nordic leaders (Sweden, Norway, Denmark, Finland, Iceland) poking fun at US President Trump and Saudi king Salman

The Nordic leaders (Sweden, Norway, Denmark, Finland, Iceland) poking fun at US President Trump and Saudi king Salman. What if they would lead the G7?

Ultimately, Fioramonti very sensibly states that all those alternative indicators, like GDP itself, only display one approach to wellbeing. Therefore he speaks out against replacing GDP by another, again inherently subjective and likely flawed, indicator. At the same time, these sections are full of careful reflection on the beyond GDP revolution, and contain interesting ideas. For instance, his mapping of alternative G7 is provided an interesting narrative. The strongest 7 countries of sustainable development does not contain any of the largest economies, but brings Costa Rica, Colombia, Panama, Ireland, South Korea, Chile and New Zealand together. The G7 of happiest countries includes Denmark, Switzerland, Iceland, Norway, Finland, Canada and the Netherlands. A G7 lead by these countries would be, well, a lot of different.

A bottom-down revolution?

Apart from the top-down changes, Fioramonti also sees a bottom-up pressure on GDP. This is where his book stretches beyond the usual beyond GDP literature. While he has a point that there is an increasing community of ‘de-growth’, authentic consumption, local produce and peer-to-peer services, the question is how much we really should read into this. Does someone who drinks a regional craft beer really has his lower contribution to GDP in mind when he sips away, or does he simply value the idea of getting something from close by?

And, isn’t there a lot in the ‘sharing economy’ that has little to do with sharing? AirBnB and Uber, referred to at multiple occasions by Fioramonti, do not only have positive effects. For instance, in reducing the cost of a car ride in New York, Uber drives people out of the metro and into congested traffic. AirBnB makes it easier for people to travel, but creates it own ‘buy to rent on AirBnB’ market, pushing residents out of inner cities and seeing them replaced by one-time consumers. Modern technologies thus simply are used to generate returns in a more modern way. While the book is well thought through and a worthy read, it may stretch the argument a bit to call this a post-GDP world.

Post Navigation