Category Archives: State/policy

Who do I vote for happiness?

Tomorrow my home country, the Netherlands, goes to the polls. The Dutch political system has a low barrier to enter the parliament. Especially this year, this leads to a proliferation of parties: there are 28 parties on the ballot, of which around 11 to 15 stand a stance to win seats according to recent polls.

The broad offer of political ideas also resulted in a large amount of online voting tools. Nowadays, about fifty sites offer tools to compare your views with party manifestoes. Apart from two big and generic ones, others help you to determine which party to vote if you are an entrepreneur, a young voter, if you want to see swift work on climate change, and even if you smoke cannabis (this remains the Netherlands…!).


A voting tool for happiness

But there is no tool on happiness. If I want to support a politician that promotes policies improving happiness and well-being, who should I vote? Does any politician ‘run on happiness’?

Happiness is a very tricky issue for politicians. Few politicians would directly promise to make their voters happy, and for good reasons. But if you dig a bit into some of the electoral manifestoes, a couple of ideas linked to wellbeing and the beyond GDP agenda do appear.


Four out of the seven large parties have some notion of happiness

Let’s run through the seven parties performing best in the polls; known as VVD, PVV, CDA, D66, GroenLinks, SP and PvdA in their Dutch acronyms.

Three of the main parties do not dedicate a single word to these ideas. For the one-page manifesto of the Freedom Party (PVV, Geert Wilders), this is not a surprise. It’s main aim is to ban things that does not make its leader happy: islamic, asylum seekers, the koran, and public expenditure on culture, wind mills, public broadcasters, etc.

For the Christian Democrats (CDA) and especially Labour (PvdA), I am a bit surprised not see a reference. Both have paragraphs on sustainable economic development, and the link to welfare and wellbeing could be easily made there.

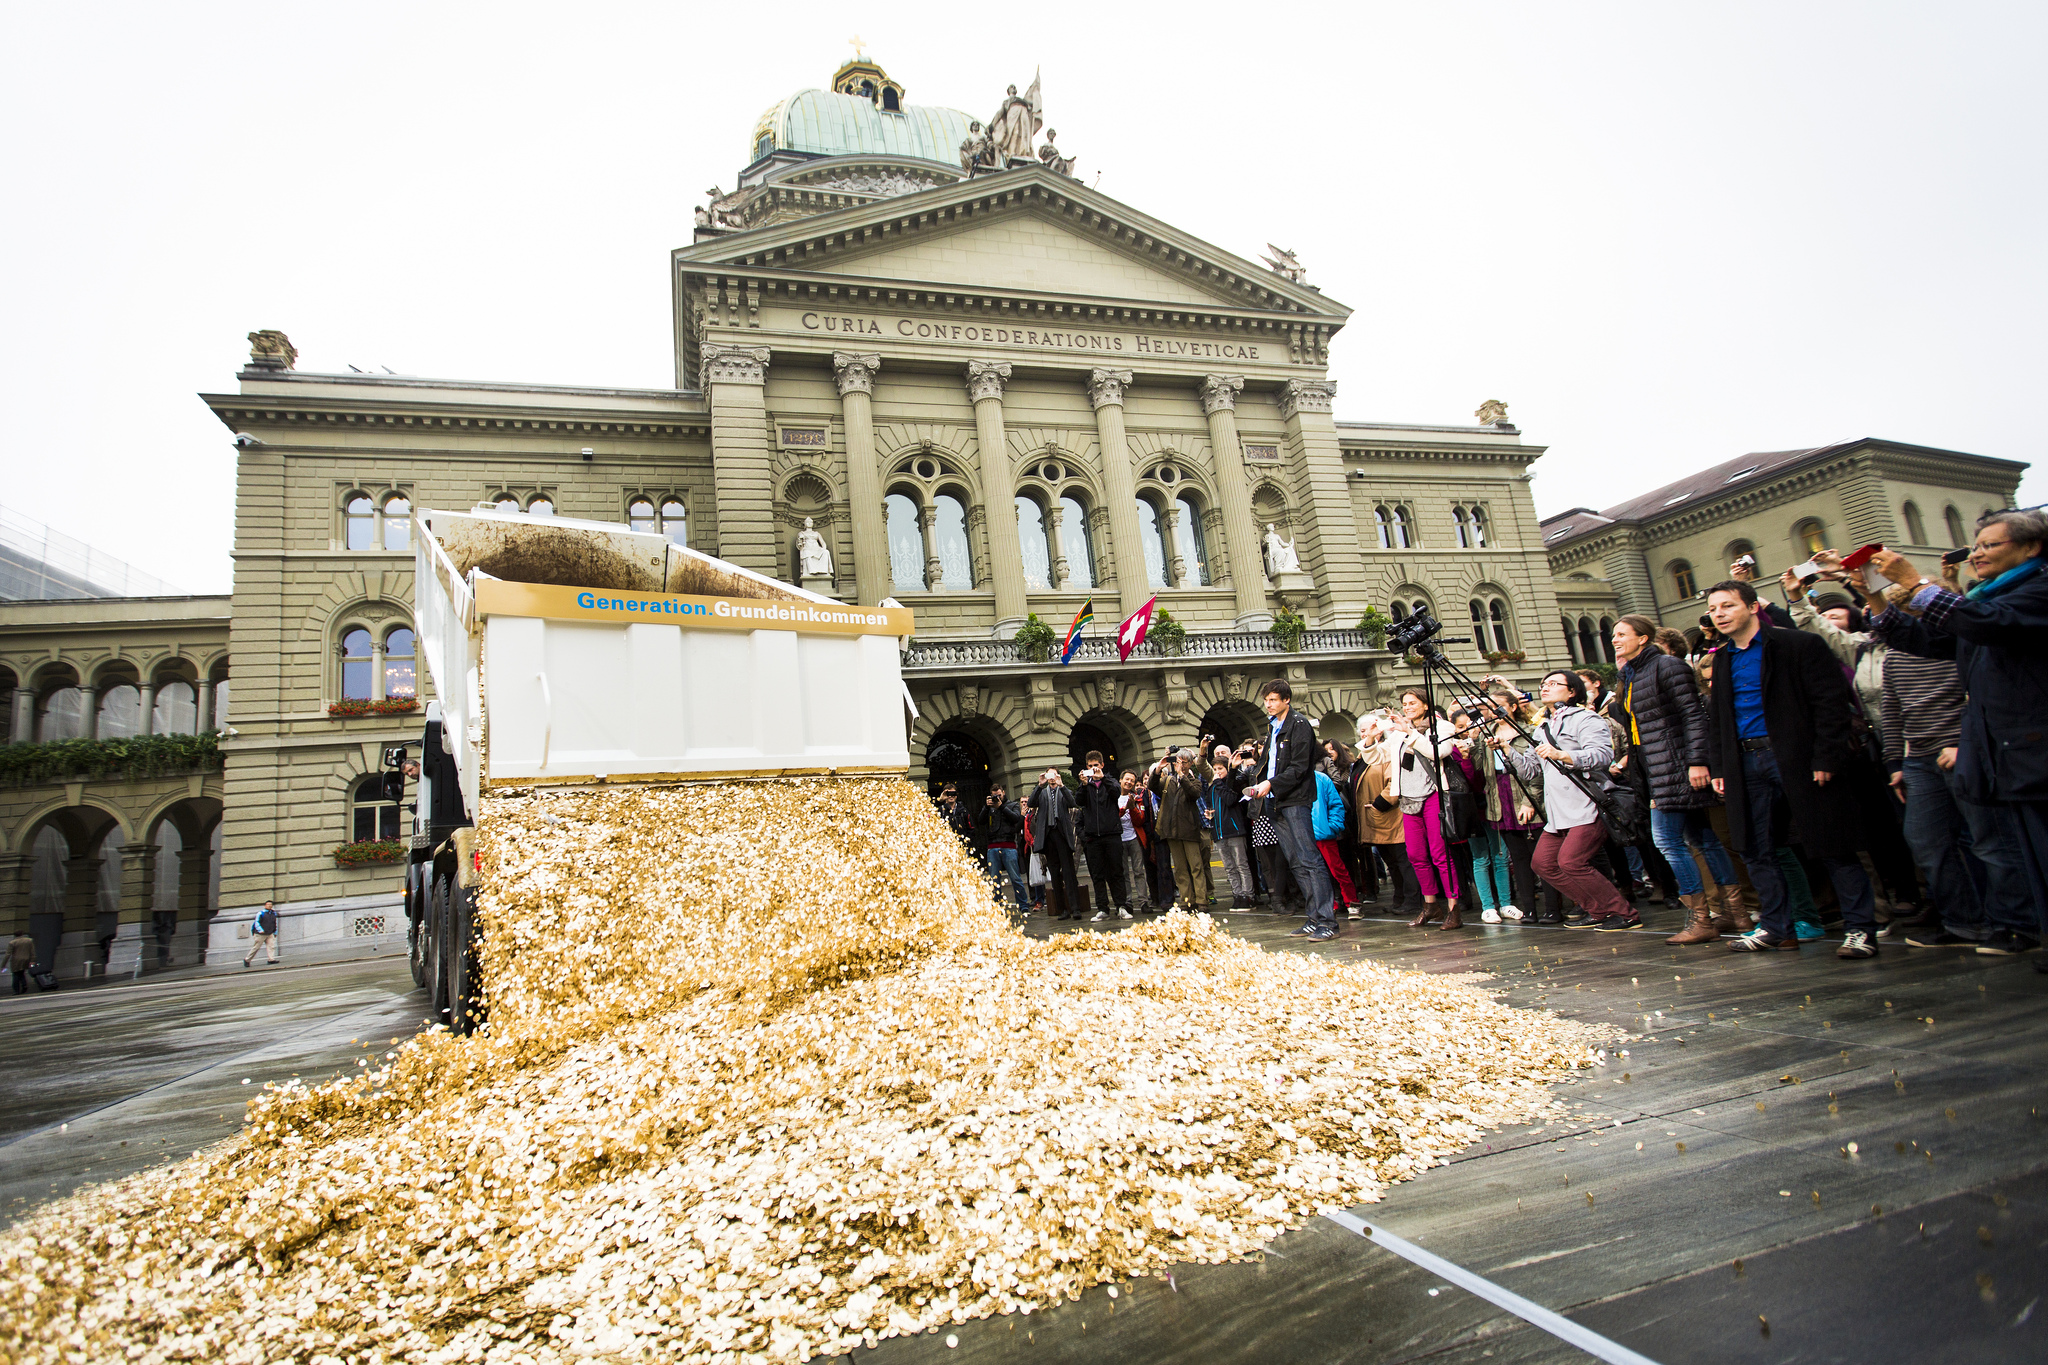
The idea of basic income – arguably also a revision to the thinking about wellbeing – appears in some manifestoes. Some smaller parties wholeheartedly support it (including a dedicated basic income party), while Labour, Greens and Social Liberals (D66) favour experiments with this tool.


Liberals: we are happy already, nothing to do here

The Liberals (VVD) programme follows Prime Minister Rutte’s relentless optimism: if the Netherlands wouldn’t exist, we would invent it. We’re one of the happiest countries of the world. Almost nowhere else life is as good as here (the Netherlands second?). But the measures it then proposes do not concern happiness or wellbeing – the programme simply focuses on prosperity. Is our happiness then just a coincidence? If our basis is so strong, isn’t there any way to strengthen wellbeing even further?


Socialists: equality makes everybody happy

The Socialists (SP) start from the correct notion that people are happier in a country with smaller differences between people, and equality is a key objective of their policies. Elsewhere, the programme notes that there is more than GDP, and wellbeing and sustainability should be considered to measure prosperity. Surprisingly, this point does not lead to a plea for alternative indicators. Instead, the relevant paragraph continues to speak out against European budget rules…


Greens: GDP is not holy

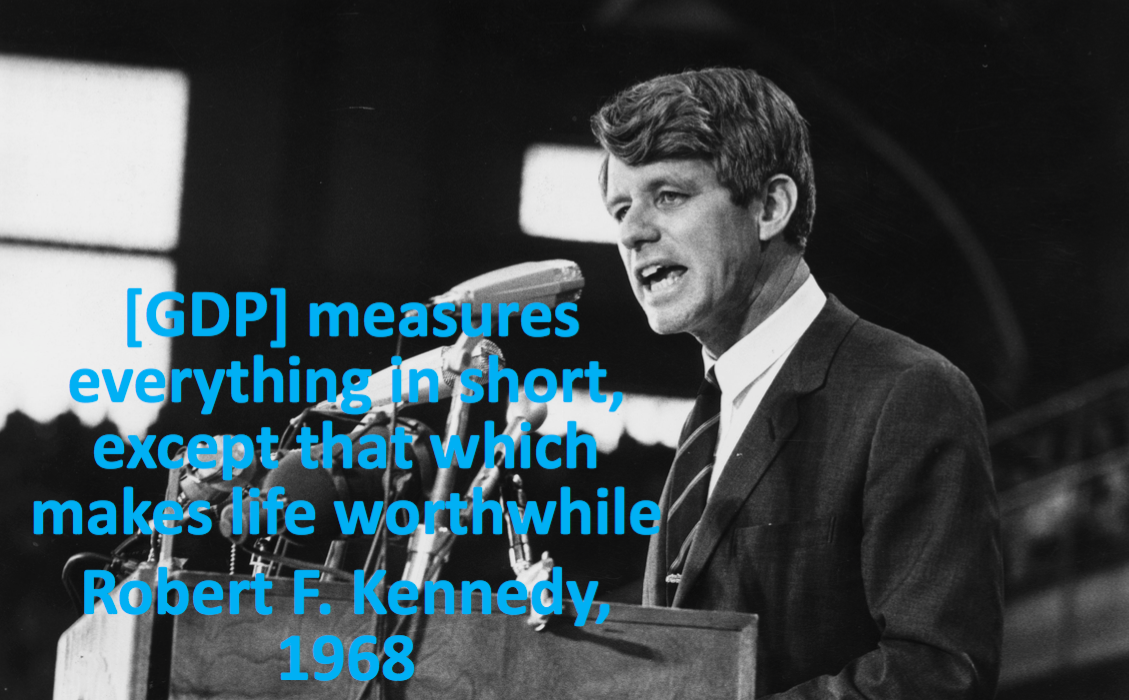
The Greens include a section on a pleasant life, with mostly has to do with nature and spatial planning. Quality of life in our neighbourhoods should be improved, and with an allusion to Robert F. Kennedy, the programme states that “the value of the beauty of the landscape, nature and animal welfare cannot be expressed in money”.

Elsewhere, the manifesto states that ‘GDP is not holy’, and that “wellbeing is a lot broader: green growth with sustainable boundaries, based on knowledge and innovation; inclusive growth, that creates good jobs and fair incomes. That is what counts.” A couple of nice quotations, surely, and the manifesto is full of utopian ideas to get to such a society. Indeed, according to the Central Planning Agency that reviewed the impact of most parties’ programmes, the Greens gets us very far in reducing income differences. Revision in the taxation system should finance this: the Greens are the most radical in greening the taxation system via the ‘the polluter pays’ principle.


Social Liberals: measure wellbeing

The Social Liberals (D66) denounce both the dogma of a government that steps too far back and the dogma of the state as a ‘happiness machine’. The programme notes that employment and social expression contribute to people’s happiness. The party also has the most detailed view on measuring wellbeing. In a dedicated paragraph, the party states that we should not only measure GDP, but also evaluate our ecological footprint, welfare, and wellbeing. These elements should be evaluated to determine our success. And based on an amendment proposed by your happiness blogger, the programme also links this to the efforts ongoing on the Netherlands to develop an alternative indicator in the form of a ‘Broad Wellbeing Monitor’.


NL happy

A world beyond GDP: are we ready yet?

On the road to discover how happiness works, I learned a lot about happiness in my own personal life – and in your personal lives, too. I’ve also gained a lot of insight in happiness at work. But the main focus of my research effort has been around another question: is there something our governments can do to make us happy?

Allow me to dwell on this question today, before I start my ‘sabbatical’ as a blogger.

I am sure that governments can make us happier, and that they should aim to do so. There are many governments that are taking happiness-based data into account when setting policies. Gross National Happiness (GNH) in Bhutan is more of philosophical guide than a hands-on policy tool, but it shapes the narrative of the government’s action. Regions in the EU and elsewhere learn from the OECD Better Life Index and Regional Well-Being Index and from Social Progress Index (SPI). And on the local level, there is an uncountable number of projects where municipalities and social society players take happiness as inspiration in social, environmental and other projects.


GDP, an increasingly poor measure of prosperity

On one of the bigger and more abstract questions I have countered on the road is whether our data helps us to work on happiness. I’ve time and again argued that Gross Domestic Product (GDP) has plenty of limitations. Instead, I assessed the virtue of alternative indicators mentioned above. And I have been far from alone in this endeavour. Back in 1968, Robert F. Kennedy already decried that GDP measures everything, except that which makes life worthwhile. In the last ten years, the debate on ‘beyond GDP’ has been particularly fierce. A cover article of the Economist some months ago summarised these limitations very well, and labelled GDP “an increasingly poor measure of prosperity”.

Can we do without GDP? Does the acceptance of the constraints of GDP mean that a real competitor has risen to the stage? Did we get anywhere in those ten years?

After three years of researching, I fear that my answers: no, we cannot yet do without . No, there is no real competitor. And no, maybe we haven’t made as much progress as we like to think. In the remainder of this post, I explain why.

Kennedy GDP


Can we do without GDP?

Ever since its creation in the 1930s, GDP provides important information about national accounts and the size of the economy. It simply measures all production that has been created in a certain territory in a year. These data are important to inform decisions on investment, government spending, and taxation. But all too often, GDP becomes a proxy for progress or prosperity. As a tool, it only measures part of productive economy: GDP falls when a man marries his maid. Indeed, if they don’t increase the economy, GDP discounts social and environmentally desirable activities, such as household work.

Furthermore, GDP is an artificial number. Figures are routinely revised, often upwards and by large margins. After a new method is used in Ireland, GDP growth is not an already significant 7.6% over 2015, but a whopping 26% as a result of some accounting tricks. Imagine the consequences: in terms GDP per capita, Irish are suddenly a lot richer, and the budget deficit shrinks by the stroke of a pen!

Despite all these limitations, GDP is probably a bit like democracy. In Churchill’s words, democracy is the worst form of government, except for all the others. We still need GDP as a tool to measure economic activity, to make sense of poverty, and to determine how much tax we need to pay to run our common society. It might still be the best we can do?


Is there any competition?

Or can we? In this blog, I’ve covered many alternative indicators, from GNH to the OECD Better Life Index to the SPI, but also the UN’s Humanitarian Development Index and even the Happy Planet Index. In my view, these are good as part of driving the narrative for a broader sense of well-being and progress. Tools like the OECD Better Life Index, GNH and the SPI can be helpful in spotting where governments need to focus resources to increase quality of life.

But they aren’t appropriate for all economic purposes. All indicators have a stronger element of arbitrary and political choices. As such, they’re too political to be used in a more economic context. Countries simply would refuse to determine financial contributions to the United Nations based on performance in the HDI, or EU regional funds based on a regional SPI score. GDP too often is seen as the more ‘objective’ metric, and even though it is not objective or stable, it is doing better than alternatives. Intriguingly, GDP is also strongly correlated with performance like HDI and SPI, even around 80% for the latter index. Although the SPI is making advances in feeding into policy, altogether none of the indices is truly challenging the position of GDP as things stand in 2016. And I don’t think it will be very different in 2018, 2020, or 2025 for that matter.


Did we make so much progress?

Then, how much progress did we make in several decades of an academic debate, and overall ten years of statistical revolution? A lot has happened. Our insights in quality of life and happiness is a deeper than at any moment in history. OECD statistical offices are now routinely gathering data on subjective wellbeing, and there is a vibrant research agenda in positive psychology and related fields. Academics and practicioners, myself included, happily travel to Bhutan to learn about GNH.

But what was generated out of this debate? Are we paying more attention to quality of life after the financial crisis? A single indicator truly competing with GDP has not been born. UN and EU authorities, as well as national governments and parliaments, have underlined the importance of alternative ways of measuring progress. But the reign of GDP has never been in danger. My feeling is that GDP is simply too important, and the alternatives too complex. I fear that we’re not ready for this revolution yet.


Time for a sabbatical

Three years on the road, my doubts on the alternatives to GDP are back. I see the beyond GDP agenda as a powerful discussion, but one that has not generated a strong enough alternative to truly challenge GDP.

On a personal level, this means that a reflection on my work is needed. Do I need to focus on something else? Do I need to work harder, or differently, for a state of happiness? Did I fail myself?

For the moment, I’ll take a break from this blog. I’ll reflect on other steps. I deserve to take some time off for a sabbatical to read more and generate other ideas. But I am sure I’ll be back with a new programme.

Because a life, enjoyably wasted in the pursuit of happiness, is a life worth wasting. Farewell!

The Social Progress Index: is your region better than its peers?

One of the common themes in my explorations on this blog has been in ‘alternative indicators’, or tools that are better equipped to measure quality of life than Gross Domestic Product (GDP). One of the most prominent ‘beyond GDP’ tools is the Social Progress Index, which I labelled “a better way to measure a good society”. And the SPI has seen a lot of development since my post of last year.

Let me start with a recap: the Social Progress Index (SPI) is developed as a broader notion of progress than GDP. It consists of 53 indicators, under the headings ‘basic human needs’ (shelter, access to clean water), ‘foundations of well-being (health, internet access) and ‘opportunity’ (human rights, social tolerance). Typically, countries tend to score higher on  basic human needs, as these often are met in high and middle income countries, even if they don’t meet the same standards on the social issues. Roughly speaking, performance for opportunity is lower, even in the richest countries. The exercise has been conducted for a couple of years now. In the 2016 update released this June, the list is topped by Finland, Canada and Denmark.

Better than your peers?

The aim of the index is similar to other beyond GDP tools I discussed like the OECD’s Better Live Index. Namely, to identify the areas of ‘progress’ or well-being in which a country is doing well, and those where it is underperforming peers. The concept of peer group is an important facet: the strengths and weaknesses are listed in comparison to a 15-country group of peers with similar levels of GDP.

This type of screening tool, in theory, could be used to help countries identify in which policy areas they could invest. The thought is that by learning from over-performing peers’ best practices, countries can use their limited resources in the most efficient way, namely by generating the highest additional well-being. The SPI has expanded a lot in the last year, starting projects with the US State of Minnesota, Reykjavik, Iceland, in the capital Bogota, other cities in Colombia and elsewhere in Latin America.

This is how the world is doing in social progress in 2016 (darker shades means higher SPI score). Source: SPI

This is how the world is doing in social progress in 2016 (darker shades means higher SPI score; grey means no data). Source: SPI

Digging down to regional level

In practice, indeed, the differences within countries are more important than between countries. More granular data at the regional and local indeed provides a lot more hands-on information to policy makers on where, and how exactly, they can do better. And the Brussels capital region may be better compared to another large city, like Hamburg, then to the province of Belgian Limburg, which in turn could learn more from a region of similar GDP as East Anglia.

That’s why both the OECD and the SPI have been complemented with data on regional level. In 2016, the SPI launched a pilot overview of the 272 regions in the EU. The Commission has released the data of the exercise in February, and an updated version is due to come out in October. And where OECD uses only 11 indicators, the European regional data provide 50 out of the original 53 of the SPI. They also built in the peer group comparison in the methodology.

Once we start comparing regions with each other in Europe, very quickly the next question comes: will the unprivileged regions get more money to bridge gap?Conceptually, one could argue that using the SPI data to address specific low performance areas is a good way to aiming investment at the area where progress can be made. But money is sensitive, and in presenting the data, the Commission has been crystal clear that it doesn’t want to revise this funding policy. Nonetheless, the granular data can provide what is necessary: a better way to measure a good, regional, society.

How is Brussels doing? A bit of under-performance compared to Hamburg, Prague, Vienna, and similar regions. Source: European Commission/Social Progress Imperative

How is Brussels doing? A bit of under-performance compared to Hamburg, Prague, Vienna, and similar regions. Source: European Commission/Social Progress Imperative

The Nanny State: repression of happiness?

It’s a pedagogic dilemma all parents will face: should we be strict to our children and prohibit them to do things that are bad for them? Or should we give them the freedom to learn for themselves that sand is not tasty, that you can fall if you climb a tree and that a drink too many has dire consequences the next day?

At the state level, similar dilemmas arise. Social-democrats traditionally don’t scare away from a dose of paternalism to educate citizens. Libertarians, on the other hand, abhor states that coerce a certain type of behaviour. Which recipe works best to develop a happy society?

Two weeks ago, I addressed the question “does size matter” – when it’s about the size of the state and happiness levels, that is. The evidence indicated that some of the happiest states are smaller countries, and that after a certain level? There is – surprisingly – a positive correlation between higher tax and higher life satisfaction. Does that also mean that a more active government, a Nanny State, could contribute to higher levels of happiness?

Nanny State Index

Republicans in the US and liberals in EU States – such as Dutch PM Rutte – agree on one thing: big government is big enough, and the state shouldn’t interfere too much with individuals’ life. That’s also the thought behind the Nanny State Index. It has been developed by liberal or libertarian think-tanks, and maps the strictness of regulation affecting personal choice in the 28 countries of the EU.

The Index lists four areas: e-cigarettes, tobacco, alcohol, and food. There is quite a difference in the freedom of access to this products across the EU. For instance, in Sweden alcohol is only available in state stores and e-cigarettes are effectively prohibited in Belgium.

Altogether, two of the paternalistic Nordics, Finland and Sweden, top the list. They stay ahead of UK and Ireland. As a result of strict rules on tobacco and so-called ‘sin taxes’ on unhealthy foods and drinks, Hungary completes the top-5. Denmark, which one might expect to be in sync with paternalist Nordics, only ranks 12th. On the lower end of the scale, we find Netherlands, Luxembourg, and Germany. The freest country of all is… the Czech Republic.

Nanny State Index. Source: www.nannystateindex.org

Nanny State Index. Source: www.nannystateindex.org


Does repression, or freedom, bring happiness?

Is there any correlation visible between being a nanny and low and high happiness levels? The evidence is difficult to interpret: the three top-1o countries of the World Happiness Report rank at different places in the Nanny State Index. Swedish is on top of the list, the Netherlands at the bottom, and to confuse the picture further, Denmark is mid-way in the table.

The implication might be the following. Policies may work out differently in different settings. It’s probably the same with children: all are different. Some kids will exploit freedom and end up in troubles; other will feel their confidence strengthened and will be good and happy citizens.

Basic income: utopian dream or the road to happiness?

Few ideas are more exciting for a happiness economist than a basic income. It sound like utopia: free money for everybody. Could it actually work?

The Swiss basic income referendum

The Swiss electorate had the chance to have its say on Sunday. And the answer is a resounding ‘no’: 77% of the population opposed the idea of a basic income. In the design for the Swiss referendum, the basic income would be unconditional: nothing would be demanded from citizens in exchange for the transfer of money. The level of the basic income would have to be set by law, according to the initiators, but they argued that 2,500 CHF for adults (around 2300 Euro) and 625 CHF for children would be an appropriate figure. That sounds like a lot, but remember that Switzerland is rich: a salary for a supermarket worker is around 3,000 CHF.

Proponents of the basic income argued that it would “enable the population to live a dignified life and to participate in public life”, providing people the freedom to live their life as they want. They also argued that basic income would be needed in an age where robotisation and digitisation would mean that many current jobs won’t exist anymore in ten years. The basic income has also been portrayed as an easier way to provide social security in a modernised and more efficient welfare state.

Opponents argued – not surprisingly – that the math behind the idea doesn’t add up. According to estimates, the Swiss state would spend around 200 bn CHF, or 35% of GDP, to pay its citizens such a basic income. It would require around 25 bn CHF extra in taxation revenue (which may have pros, as we saw last week) or expenditure cuts to finance the scheme. Beyond that, the idea would risk to destabilise the entire economy, as people wouldn’t work as much as before. In addition, there were moral arguments on the national laziness that would ensue.

Switzerland won’t have a basic income. But don’t believe proponents are demotivated by the loss. Instead, they see the fact that over 20% supported such a radical income as a sign that the real public debate is only about to start.

Performance by the initiators of the referendum, who dumped 8 million coins at a square when they reached the necessary number of 125,000 signatures to call the referendum. Source: Wikipedia,

Performance by the initiators of the referendum, who dumped 8 million coins at a square when they reached the necessary number of 125,000 signatures to call the referendum. Source: Wikipedia,

A Finnish experiment in simplification

While I am sympathetic to the idea, I do have my doubts on the math. It might be worth studying the consequences of a basic income for a smaller group, before implementing it for everybody. That is exactly what will be done in Finland: in 2017, it will provide a basic income to 10,000 lucky sampled citizens. Participation is mandatory. Importantly, the Finnish experiment will also simplify the social security system as part of the exercise.

Some proponents support basic income as a way to rationalise the various categories of social expenditure. Finland has around 100 different categories of social security spending, and during the experiment 50 of these would be replace by one single basic income. Also in other countries, citizens are subsidised for several hundreds of euro per month, for instance via services accessed for free. Couldn’t all this be simplified into one basic income? Or would it still be impossible to fund it? The Finnish experiment will be closely watched.

Free money, a way to happiness

Even if we may be unable to introduce free money for all, there are a couple of lucky people who actually received a basic income. The German foundation Mein Grundeinkommen crowd-funds a basic income: every time when they’ve gathered 12,000 Euro, one winner gets a basic income for one year. And according to its director Michael Bohmeyer (who receives his own monthly 1000 Euro basic income via the proceeds of shares in the company he left), the results are amazing.

Speaking at a panel discussion in Brussels, Bohmeyer told how he feels a lot more free, secure and relaxed with his basic income. When receiving the income, he realised how much people are in running mode every day. Work and the need to have a salary to provide for our life results in a lot of stress.

In his experience, that doesn’t mean that nobody would work anymore if they receive a basic income. Of the around 40 people who won a basic income through the lottery, all but one continued to work. And maybe it’s an issue of low trust in others: when asked if others would still work when they have a basic income, around 80% said no. When the question was if they themselves would still work, around 90% said they’d continue to work, says Bohmeyer (video in German).

Basic income may not only about simplified social security, but also about a better work-life balance and higher happiness. Let’s hope that the Finnish experiences shows that it is actually possible to get the math right.

For another passionate case on basic income, see the talk of Rutger Bregman, a Dutch journalist and basic income enthousiast. He wrote a book on the basic income under the title ‘Utopia for Realists‘.

Does size matter: higher tax, happier countries?

One of the oldest questions in political philosophy is of course: does size matter? Or to phrase it more precisely for the aims of this blog, does the size of the state influence the level of happiness of its population?

There are two ways of looking at the questions. Firstly, does the size of population matter for the quality of life? And secondly, how large a role should the government play in society?

Small is beautiful

At least at the anecdotal level, the first question is relatively to answer. It appears that smaller countries, typically, have happier populations than larger ones. From a theoretical angle, that makes sense. If a country is smaller, it is more likely to have a more homogenous population, and people are more likely to feel close to each other. For instance, this would result in a better community life, one of the factors associated with happiness. A glance at the 2016 World Happiness Report shows that most of the top-ten countries are relatively small, with Denmark, Switzerland and Iceland in the top-three, and only Canada, Netherlands and Australia (numbers six, seven and nine) having a population above 10 million.

Schermafbeelding 2016-05-22 om 18.37.08

Father state makes you… happy?

There is a second way of looking at the question, though. Does the share that the government takes in the economy and society affect happiness levels? Is it the invasive Big Government or rather the freedom of the laissez faire night-watcher state that makes people best off?

A book by Benjamin Radcliff, The Political Economy of Human Happiness, suggests there are three ways of measuring state size when assessing the correlation: welfare spending; overall government spending; and taxation.

From a theoretic perspective, one could presume a link between government spending and happiness. For instance, welfare policies could be expected to provide the safety net to lower income and/or unemployed people, and therefore reduce inequality. Similarly, a large amount of government spending – for instance by providing free or subsidised education or healthcare – could result in higher happiness levels.

Indeed, the evidence assessed by Radcliff suggests this kind of link. His data shows that for one of the metrics, linked to welfare spending, countries scoring high on this indicator, happiness levels are above one point higher than low-scoring countries. He suggests that this contribution to happiness is double that of being married (being married is positively correlated with happiness), and three times the negative drag of unemployment. To give an example: if your baseline happiness is 7, living in a state with high spending would statistically increase your happiness to 8. Being unemployed would drag it down to 6,7. That’s the magnitude of the influence of the state size according to Radcliff’s evidence!

More tax, more happiness

Government spending doesn’t come for free. While taxation of citizens and companies isn’t the only source of income, it typically is the most significant one. Could it really be the case that being taxed more resulted in citizens being happier?

Again, the data suggest there is a correlation. Radcliff even states that “higher levels of taxation suggest higher levels of satisfaction with life”.

The graph here compares taxation levels (tax revenue as % of GDP) with happiness levels (life satisfaction), based on data from the OECD and the World Happiness Report quoted above. It shows an increasing trendline, associating a level of taxation of 20% in this group of OECD countries with a happiness level of around 6.5. All others thing equal, a level of 50% is correlated with a happiness level of around 6.8: some one thirds of a point higher across the trendline.

But not all others things are equal: the distribution is broad and the effects are very diverse. Denmark is on the top right with a happiness level of 7.526 and the very highest tax level of 50,9. On the far left, we find Switzerland with a marginally lower happiness level of 7.509 and only half the tax rate at 26.6%. On the lowest part of the graph, with happiness levels just above 5 points, we find Portugal, Greece and Hungary, with taxation levels around 34-38%.

tax vs happiness


Correlation, goes the warning to every first-year student, is not causation. The 34 countries of the OECD provide some interesting figures, but there are many other factors than taxation that determine happiness. Idiosyncratic factors and practical things like a state’s efficiency – what kind of society does is create with the 20 or 50% tax money it collects? – certainly also play a role. I’ll look at some of what the states does next week: the Nanny State.

Keynes’ dream: how to get to a 15-hour working week by 2030

For many ages to come the old Adam will be so strong in us that everybody will need to do some work if he is to be contented. We shall do more things for ourselves than is usual with the rich to-day, only too glad to have small duties and tasks and routines. But beyond this, we shall endeavour to spread the bread thin on the butter-to make what work there is still to be done to be as widely shared as possible. Three-hour shifts or a fifteen-hour week may put off the problem for a great while. For three hours a day is quite enough to satisfy the old Adam in most of us!

In his essay on “The Economic Possibilities of Our Grandchildren” from 1930, economist John Maynard Keynes famously predicted that in the future, people would only work fifteen hours a week. In hundred years, he wrote, the standard of life in progressive countries would be four to eight times higher than in 1930. In the extract above, he wrote that  for ‘the old Adam’ in 1930, a fifteen-hour working week would be necessary to fairly divide the available work across the population.

With 14 years to go, there’s still a lot that needs to be changed!

Considering the gap between current working hours of 35 (officially in France), 40 hours for most and 50-60 or more for workaholics, maybe we should strive to reduce our working hours in smaller steps at first?

According to OECD data, the average working hours per year stands at 1770 hours per year across the OECD countries. These are not equally divided through the year (think of Easter, summer, and Christmas breaks): the weekly average is probably around 37 hours. These figures are actually worked hours, per worker, so including part-time workers and seasonal labour.

Against prejudices, the number of hours stands at 42 in Greece; in Germany and the Netherlands, the average is around 30. In the latter two, these figures are skewed by the high proportion of part-time workers, but also can be seen as a sign of high labour productivity! And surprisingly, it’s not Americans or Japanese that put in most hours. Instead, the workaholics of the OECD live in… Mexico. At 2238 hours per year and some 45 per year, the average person’s working week is some 50% longer than in Germany and the Netherlands.

Working hours in euro area and selected third countries. Source: OECD

Working hours in euro area and selected third countries (click to enlarge) Source: OECD


Step 1: down to 30 by 2020

What if we could achieve this level of 30 hours without these tricks? In their history, the Green and Socialist Parties in Sweden have aimed to reduce working hours to 30 per week. Scandinavian countries have a reputation for a healthy work-life balance and indeed are towards the left of the curve. Swedes work a bit more than the French with their 35-hour working week policy.

Last year, a retirement home in Gothenburg started to experiment with a 30-hour working week. Nurses tell researchers they feel they have more energy. The experiment is funded with a subsidy of around 500,000 euros to compensate for the higher number of staff needed to care for the residents.

But other examples cited in another article, such as creative and service industries, suggest that not so much more staff is needed. People still want to do a good job, and may achieve similar levels of productivity in six hours as in eight, says an app developer. With some testing and refinement, wouldn’t we able to get this rolled out by 2020?

Step 2: let’s get down to 21 by 2025

From the perspective of the new economics foundation, a think-tank on “economics as if people and the planet mattered”, getting down to 30 is good, but only halfway there. In a pamphlet and a TEDx talk, researcher Anna Coote argued for a 21-hour working week ambition (she herself, a recovering workaholic, is at 30 hours).

She argues that shorter working weeks would have a range of social and environmental advantages. For instance, it would distribute work more evenly across society, and hence reduce unemployment, and increase our ecological footprint. Now, we are getting close to Keynes’ expectations 85 years back. Doesn’t it sound utopian to work only four/five hours per day, four or five days per week? Or is it really feasible to do this within ten years, coinciding with decarbonisation of the economy and lower energy use to meet the targets of the COP21 climate change agreement?

Step 3: down to 15 by 2030 – or why not limit us to 4 hours?

But for the American dream, 21 hours is not good enough, and we might be able to do better than Keynes’ 15 hours. American dream salesman and self-help author Tim Ferriss wrote a well-known book entitled the ‘Four-Hour Working Week‘. In the book, he explains that for most entrepreneurs, a small amount of clients brings in most of the revenue. As such, by focusing on these, outsourcing all support functions, and living in low-cost countries, Ferriss claims it is possible to only work four hours a week. Whether you take this as a serious career option or too-good-to-be-true, it’s not a model that could apply to society as a whole.

If everybody were to work only four hours, our economic system would come to a stop. But Keynes 15 hours? If we really change our economy’s paradigm, maybe we can get it done by 2030…

Does GNH policy work? The answer is in common values

What is Gross National Happiness (GNH) actually good for? And how do policymakers in Bhutan really use their unique development tool?

In previous posts, I’ve dived into the methodology of GNH and crunched some of numbers behind the 43,4% of happy Bhutanese. GNH was once developed to provide an alternative to the logic of mere economic development. Obviously, in the end GNH is as good or as bad as it will be used. As an observer, it seems that Bhutan stands close to GNH, for instance in environmental policy and community life.

But to really know how it works, I asked Kent Schroeder at Humber College, Canada to help me find out if GNH leads to different government decisions. He should know: he did his PhD on the implementation of GNH in Bhutan, and interviewed around 150 policymakers on all levels.

Who’s doing GNH?

Schroeder told me that several Bhutanese institutions are working on GNH: the GNH Commission, the think tank Centre for Bhutan Studies (CBS), and the government.

  • The GNH Commission is a powerful body that is consulted by the government on the GNH effects of new policy initiatives. It’s reviewing new public policy initiatives before adoption. And the GNH Commission even publishes draft policies online, allowing the public to comment.
  • In addition, there is a policy screening tool, through which the Commission reviews the impact of a prospective policy on the nine domains of GNH. The tool scores all elements of the policy on a scale from 1 to 4: 1 means a negative impact, while 4 means a positive impact. In the EU bubble, we would call this a happiness impact assessment!
  • The most prominent example of the use of the policy screening tool leading to different results was the question on whether Bhutan should join the World Trade Organisation (WTO). After reviewing the consequences on GNH, the GNH Commission advise against becoming party to global free trade rules.
  • The CBS is also a highly recognised think tank, and is the driving forced behind the GNH index I’ve written so much about.
  • And then of course there are all policymakers at national, district and local level who formally all are required to follow the concept of GNH in their policies. Schroeder tells me that the GNH principle is taken into account for Bhutan’s five-year plans. In the next cycle, GNH will be devoluted, meaning that local administrations should take more responsibility. Officials can use local checklists similar to the national screening.

Does it work?

So, the means are there to effectively integrate GNH in public policy. But does it work in practice? To answer that question, Schroeder in his PhD thesis research reviewed four policy areas, namely media, tourism, farm roads, and human-wildlife conflict.

His conclusions about the effectiveness of GNH policies are as follows:

  • The influence of GNH on policy actions is unpredictable. Policies are shaped in a complex policy process, and the level of influence of different actors across policy areas and districts. As such, the impact of GNH policy tools on policy processes is limited.
  • Bhutanese citizens, and even policy makers, often do not understand what GNH really means. There is no common concept and these different interpretations also affect the policy process. Simply put, GNH is often not understood!
  • As a result, the outcome varies per policy area. Media and tourism policies largely reflect the aims of GNH. For farm roads, on the short term policy conforms with the GNH concept, but on the long term, Schroeder doubts its effect on sustainability. Finally, for the policies on the interaction on human and wildlife – a real issue in Bhutan where farmers often have to stay awake in the night to chase animals from their farmland – the result is mixed. This is also a consequence of the ambiguity of GNH.

Common values ensure GNH

Reading this, one would doubt the relevance of GNH as a concept. But there is no reason to be so dire. Even though the process is not as structured as the concept would suggest, the underlying values used by policy makers in determining their course of action typically conform with the values of GNH. As such, policy outcomes often reflect what GNH would imply – even if they’re not recognised as being connected with GNH!

GNH: 2015 survey finds 43,4% of Bhutanese are happy

How happy is Bhutan?

According to the 2015 Gross National Happiness (GNH) survey, 43,4% of the Bhutanese are considered happy.

This figure is the outcome of the survey by the Centre for Bhutan Studies and GNH research for 2015. During the survey, researchers interviewed 7.153 respondents, asking them 148 questions each to distill their GNH. The number came about via a complex methodology, which is about a lot more than just asking people about their life satisfaction.

How are people happy?

  • 8.4% of Bhutanese are ‘deeply happy’ (or scoring over 77% of the weighted indicators), against 8.3% in the 2010 survey.
  • 35.0% are ‘extensively happy’ (score of 66-76%), going up from 32.6% in 2010
  • 47.9% are ‘narrowly happy’ (score of 50-65%). In 2010, this group of narrowly happy people was larger, at 48.7%
  • Only 8.8% are considered ‘unhappy’ (below 50%) in 2015, while in 2010, 10.4% were unhappy.

This shows a small increase of GNH between 2010-2015. But as Bhutanese Prime Minister Tshering Tobgay said when presenting the results during the GNH conference, we cannot really interpret what this increase means:

“Is this [increase in GNH] fast or slow? We don’t know.”

Some of the other outcomes:

Urban up, rural more slowly

  • People are happier in urban areas and the improvement is stronger in urban areas than in rural areas (the survey is designed to be representative for both the urban and rural area in every of Bhutan’s 20 districts).
  • This is quite remarkable given the quick modernisation and urbanisation. As CBS researcher Thsoki Zangmo told me, Bhutanese living in cities score better on living standard and education, but worse on community and cultural indicators. This might suggest that the departure of people to the city affects community life in rural place of origin more than in the city, the destination.
  • But these findings are provisional – the CBS will publish more detailed analysis next year. And, Tshoki says, we need more data points to really understand these factors. Therefore, the survey will be repeated every three of four years.

More happiness for everybody

  • Roughly, improvements seem to be equalising: improvements are stronger under disadvantaged groups (women, elders, uneducated, and farmers). However, the survey design is not representative so these findings are indicative

Smaller downs, bigger ups 

  • Confusingly, no less than 14 individual domains and indicators show decreases. However, these are more than offset by (larger) increases in 11 indicators. Roughly, ‘harder’ domain as living standards and health improve, while ‘softer’ ones like community vitality and psychological well-being decrease.

Dreaded government offers good services 

  • A final remarkable finding is that the young Bhutanese democracy – established 2008 – quickly has created a complex relation with politics. As Prime Minister Tobgay didn’t shy away from mentioning, the perception of government is down by 48 percentage points. Both Tobgay and the researchers contributed that to the euphoria about the new democracy resulting in a high score in 2010, whilst electoral bickering in 2013 may have reduced the number in the 2015 survey.
  • At the same time, however, the satisfaction with government services has increased by 20 percentage points. In short, Bhutanese are very satisfied with public services delivered by a dreaded government!
View in front of my hotel in Paro Valley

View in front of my hotel in Paro Valley

How is Gross National Happiness measured in Bhutan?

I’ve already written about the concept of Gross National Happiness (GNH) a lot. But attending the international GNH conference in Paro, Bhutan, I have improved my understanding of what GNH really means. In a couple of blog posts, I want to outline the methodology, the 2015 survey findings, and the actual use of GNH as a policy tool.

Let’s start with the methodological part here. It’s a bit more technical exercise, but at least it helps to understand what we are really talking about when referring to GNH and where the numbers come from. If you’re interested in the results for 2015, be patient for a couple of days.

The nine domains and 33 indicators of GNH

GNH has been devised by Bhutan as an alternative indicator for GDP as a tool to measure progress or development. The level of GNH for an individual and for Bhutan as a country are determined through measures in nine domains. The Centre for Bhutan Studies and GNH research’s nine domains (see picture below) are all based on well-being research determining their link to well-being and happiness.

The nine domains of GNH. Source: Provisional findings of 2015 GNH Survey

The nine domains of GNH. Source: Provisional findings of 2015 GNH Survey, p. 11

All domains are weighted equally, or at 1/9. For most domains, there are four underlying variables. Each of the 33 variables is tested through one or more questions within the 1,5 hour personal interview. For instance:

  • the domain education is measured via asking respondents about the variables literacy, schooling, knowledge about certain areas, and values.
  • Living standards are measured through the indicators household income, assets, and housing.
  • The psychological well-being measure consists of life satisfaction, positive emotions, negative emotions, and spirituality.

The weights of the various variables in a domain are unequal. The different weights are based on scientific reliability and validity. In general, subjective (or personal) indicators have been given lower weights than objective (or factual) indicators.

How do all these answers result in a GNH score for an individual and for the country as a whole?

It’s not just a simple average. As statisticians say,

When your head is in the oven and your feet in the freezer, your average temperature is normal

In happiness, averages don’t count: e.g. a excessively low level of positive emotions cannot be countered by an extremely high level of household income.

Sufficiency targets

For this reason, within each indicator, a ‘sufficiency target’ is set to reduce the impact of outlier answers. A person is considered ‘happy’ under this indicator when the ‘sufficiency’ level is achieved. For example, sufficiency targets are set as follows:

  • ‘Six years education’ for the indicator ‘schooling’ in the domain education
  • A monthly income level of 23.127 Ngultrum (about €325) for the indicator ‘household income’ in the domain living standards.
  • For the indicator ‘life satisfaction’ in the domain psychological well-being, a score of 19 out of 25 points on five questions related to satisfaction with health, occupation, standard of living, family, and work-life balance.

Thresholds to be ‘extensively’, ‘deeply’, or ‘narrowly’ happy

Based on all answers for the 33 indicators, it can be determined on how many indicators a person is sufficient, and a judgement is given how happy a person is. These thresholds are as follows:

  • Sufficiency in 77%-100% of the weighted 33 indicators: deeply happy
  • Sufficiency in 66%-76%: extensively happy
  • Sufficiency in 50%-65%: narrowly happy
  • Sufficiency in 0%-49%: unhappy or ‘not-yet-happy’

Of course these cut-off limits are arbitrary. If we want to express the GNH or happiness in a number, I would consider the first two categories as happy, and the lower two as unhappy. But in one Bhutanese newspaper, I’ve read an article grouping the first three under ‘happy’, hence resulting in a headline stating that more than 90% of Bhutanese are happy.

How valid are these figures?

Within happiness research, there is a continuous discussion on the reliability, validity, and overall usefulness of indicators to measure happiness, well-being, life satisfaction, and quality of life. An important part of these is the distinction between objective and subjective indicators.

For instance, a subjective indicator like ‘life satisfaction’ asks people to rate their overall level of life satisfaction. Of course people throughout cultures and with different personalities would assess their levels differently. A certain level of happiness could be expressed as an 8 by one person and as a 7 of another person. In addition, the bias might differ from country to country. For instance, one could theorise that people in Bhutan aware of the concept of GNH could be under pressure to answer with a high number, increasing the average.

To some extent, the use of objective criteria – like the number of years of schooling – avoids these problems. But again, there are problems with objective criteria. Most importantly, they assume that the researcher can reliably determine what qualify of life is for a respondent. What if a person has had only five years of schooling, but is still satisfied with this? Ultimately, there is no way around this dilemma, and it is one of the reasons for criticism of alternative indicators.

It’s the trend, not the headline figure, that counts

Happiness, though, is not an exact science. Parties deal differently with this reality. The Centre for Bhutan Studies (and also, the OECD), has considered that the best way is to use objective indicators where available, and subjective indicators where necessary. As researcher Tshoki Zangmo explained me, the CBS feels that a balance is needed as they’re both important to determine GNH.

When you dig deep into these, every choice has methodological and practical limitations. Every measure for happiness or well-being is imperfect, arbitrary and subject to criticism. Of course the same can be said for the GDP measures that happiness indicators aim to provide an alternative for!

Also, the trends within the nine different domains and constituent indicators are probably more relevant for the policy than the ultimate outcome in numbers. For instance, a finding that psychological well-being is decreasing, that might be a lot more useful input to public policy than the conclusion that overall GNH is 0.756.

The present article is based on the methodology of the GNH index 2015 and some separate questions to CBS researcher Tshoki Zangmo.

IMG_3223

The conference tent, with the stage in the front, seen from my seat among a group of local high school students.