I’ve already written about the concept of Gross National Happiness (GNH) a lot. But attending the international GNH conference in Paro, Bhutan, I have improved my understanding of what GNH really means. In a couple of blog posts, I want to outline the methodology, the 2015 survey findings, and the actual use of GNH as a policy tool.
Let’s start with the methodological part here. It’s a bit more technical exercise, but at least it helps to understand what we are really talking about when referring to GNH and where the numbers come from. If you’re interested in the results for 2015, be patient for a couple of days.
The nine domains and 33 indicators of GNH
GNH has been devised by Bhutan as an alternative indicator for GDP as a tool to measure progress or development. The level of GNH for an individual and for Bhutan as a country are determined through measures in nine domains. The Centre for Bhutan Studies and GNH research’s nine domains (see picture below) are all based on well-being research determining their link to well-being and happiness.
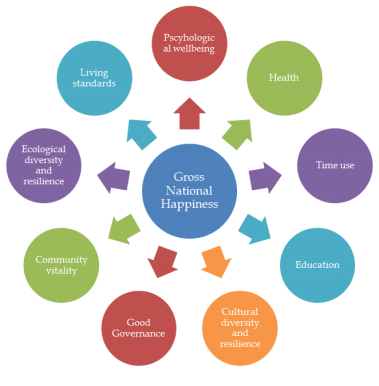
The nine domains of GNH. Source: Provisional findings of 2015 GNH Survey, p. 11
All domains are weighted equally, or at 1/9. For most domains, there are four underlying variables. Each of the 33 variables is tested through one or more questions within the 1,5 hour personal interview. For instance:
- the domain education is measured via asking respondents about the variables literacy, schooling, knowledge about certain areas, and values.
- Living standards are measured through the indicators household income, assets, and housing.
- The psychological well-being measure consists of life satisfaction, positive emotions, negative emotions, and spirituality.
The weights of the various variables in a domain are unequal. The different weights are based on scientific reliability and validity. In general, subjective (or personal) indicators have been given lower weights than objective (or factual) indicators.
How do all these answers result in a GNH score for an individual and for the country as a whole?
It’s not just a simple average. As statisticians say,
When your head is in the oven and your feet in the freezer, your average temperature is normal
In happiness, averages don’t count: e.g. a excessively low level of positive emotions cannot be countered by an extremely high level of household income.
Sufficiency targets
For this reason, within each indicator, a ‘sufficiency target’ is set to reduce the impact of outlier answers. A person is considered ‘happy’ under this indicator when the ‘sufficiency’ level is achieved. For example, sufficiency targets are set as follows:
- ‘Six years education’ for the indicator ‘schooling’ in the domain education
- A monthly income level of 23.127 Ngultrum (about €325) for the indicator ‘household income’ in the domain living standards.
- For the indicator ‘life satisfaction’ in the domain psychological well-being, a score of 19 out of 25 points on five questions related to satisfaction with health, occupation, standard of living, family, and work-life balance.
Thresholds to be ‘extensively’, ‘deeply’, or ‘narrowly’ happy
Based on all answers for the 33 indicators, it can be determined on how many indicators a person is sufficient, and a judgement is given how happy a person is. These thresholds are as follows:
- Sufficiency in 77%-100% of the weighted 33 indicators: deeply happy
- Sufficiency in 66%-76%: extensively happy
- Sufficiency in 50%-65%: narrowly happy
- Sufficiency in 0%-49%: unhappy or ‘not-yet-happy’
Of course these cut-off limits are arbitrary. If we want to express the GNH or happiness in a number, I would consider the first two categories as happy, and the lower two as unhappy. But in one Bhutanese newspaper, I’ve read an article grouping the first three under ‘happy’, hence resulting in a headline stating that more than 90% of Bhutanese are happy.
How valid are these figures?
Within happiness research, there is a continuous discussion on the reliability, validity, and overall usefulness of indicators to measure happiness, well-being, life satisfaction, and quality of life. An important part of these is the distinction between objective and subjective indicators.
For instance, a subjective indicator like ‘life satisfaction’ asks people to rate their overall level of life satisfaction. Of course people throughout cultures and with different personalities would assess their levels differently. A certain level of happiness could be expressed as an 8 by one person and as a 7 of another person. In addition, the bias might differ from country to country. For instance, one could theorise that people in Bhutan aware of the concept of GNH could be under pressure to answer with a high number, increasing the average.
To some extent, the use of objective criteria – like the number of years of schooling – avoids these problems. But again, there are problems with objective criteria. Most importantly, they assume that the researcher can reliably determine what qualify of life is for a respondent. What if a person has had only five years of schooling, but is still satisfied with this? Ultimately, there is no way around this dilemma, and it is one of the reasons for criticism of alternative indicators.
It’s the trend, not the headline figure, that counts
Happiness, though, is not an exact science. Parties deal differently with this reality. The Centre for Bhutan Studies (and also, the OECD), has considered that the best way is to use objective indicators where available, and subjective indicators where necessary. As researcher Tshoki Zangmo explained me, the CBS feels that a balance is needed as they’re both important to determine GNH.
When you dig deep into these, every choice has methodological and practical limitations. Every measure for happiness or well-being is imperfect, arbitrary and subject to criticism. Of course the same can be said for the GDP measures that happiness indicators aim to provide an alternative for!
Also, the trends within the nine different domains and constituent indicators are probably more relevant for the policy than the ultimate outcome in numbers. For instance, a finding that psychological well-being is decreasing, that might be a lot more useful input to public policy than the conclusion that overall GNH is 0.756.
The present article is based on the methodology of the GNH index 2015 and some separate questions to CBS researcher Tshoki Zangmo.

The conference tent, with the stage in the front, seen from my seat among a group of local high school students.