Tag Archives: Oecd Better Life Index

Happiness & the City

How can growing cities ensure the well-being of their citizens isn’t sacrificed in their growth? That was one of the questions I had in mind when delivering a guest lecture on happiness to a group of students from Erasmus University Rotterdam in the Netherlands. The students, enrolled in a programme on city development, were specialising in ‘Urban Development, Wealth and Well-Being’. Studies of happiness seem to have gotten a lot more common in the few years I’ve been out of university!

My presentation was centred on the argument that the well-being and happiness of citizens should be a leading objective in urban planning and city development. Politicians and policy-makers should use existing regional indicators, such as the OECD Better Life Index or the Social Progress Index (SPI), to monitor their performance. Comparing scores with benchmarks of their peer group can help spot weaknesses.

For instance, the Brussels region has a high GDP, but is doing worse on many other progress indicators, as the slides in the deck below show. The South Holland region of Rotterdam and The Hague ranks highly in the SPI, but shows weaknesses in education, environmental quality, and some health and safety indicators.

Students in the group seems to see the arguments, but also had critical questions: can you objectively measure what happiness or well-being is? Can you decide for someone else how much education or the environment counts for their happiness? And can we trust politicians using well-being data fairly? Or would they simply use it as a narrative to get support, without doing the actual work?

I ended the workshop with several case studies, asking the students how they would advise mayors to resolve policy issues. They had some creative solutions: for instance, one of the case studies described a dynamic city that attracts so many people that house prices saw massive increases. One, admittedly complicated, suggestion was to cap rent prices so normal people could afford to live there. This case study was meant to be similar to London. Another creative idea by the group was to build a satellite city at a reasonable distance. In this way, people could enjoy well-being in their place of residence, while also enjoying the dynamic life that London has to offer. One thing became clear: the next generation of urban planners will be thinking about happiness in their cities.

The Social Progress Index: is your region better than its peers?

One of the common themes in my explorations on this blog has been in ‘alternative indicators’, or tools that are better equipped to measure quality of life than Gross Domestic Product (GDP). One of the most prominent ‘beyond GDP’ tools is the Social Progress Index, which I labelled “a better way to measure a good society”. And the SPI has seen a lot of development since my post of last year.

Let me start with a recap: the Social Progress Index (SPI) is developed as a broader notion of progress than GDP. It consists of 53 indicators, under the headings ‘basic human needs’ (shelter, access to clean water), ‘foundations of well-being (health, internet access) and ‘opportunity’ (human rights, social tolerance). Typically, countries tend to score higher on  basic human needs, as these often are met in high and middle income countries, even if they don’t meet the same standards on the social issues. Roughly speaking, performance for opportunity is lower, even in the richest countries. The exercise has been conducted for a couple of years now. In the 2016 update released this June, the list is topped by Finland, Canada and Denmark.

Better than your peers?

The aim of the index is similar to other beyond GDP tools I discussed like the OECD’s Better Live Index. Namely, to identify the areas of ‘progress’ or well-being in which a country is doing well, and those where it is underperforming peers. The concept of peer group is an important facet: the strengths and weaknesses are listed in comparison to a 15-country group of peers with similar levels of GDP.

This type of screening tool, in theory, could be used to help countries identify in which policy areas they could invest. The thought is that by learning from over-performing peers’ best practices, countries can use their limited resources in the most efficient way, namely by generating the highest additional well-being. The SPI has expanded a lot in the last year, starting projects with the US State of Minnesota, Reykjavik, Iceland, in the capital Bogota, other cities in Colombia and elsewhere in Latin America.

This is how the world is doing in social progress in 2016 (darker shades means higher SPI score). Source: SPI

This is how the world is doing in social progress in 2016 (darker shades means higher SPI score; grey means no data). Source: SPI

Digging down to regional level

In practice, indeed, the differences within countries are more important than between countries. More granular data at the regional and local indeed provides a lot more hands-on information to policy makers on where, and how exactly, they can do better. And the Brussels capital region may be better compared to another large city, like Hamburg, then to the province of Belgian Limburg, which in turn could learn more from a region of similar GDP as East Anglia.

That’s why both the OECD and the SPI have been complemented with data on regional level. In 2016, the SPI launched a pilot overview of the 272 regions in the EU. The Commission has released the data of the exercise in February, and an updated version is due to come out in October. And where OECD uses only 11 indicators, the European regional data provide 50 out of the original 53 of the SPI. They also built in the peer group comparison in the methodology.

Once we start comparing regions with each other in Europe, very quickly the next question comes: will the unprivileged regions get more money to bridge gap?Conceptually, one could argue that using the SPI data to address specific low performance areas is a good way to aiming investment at the area where progress can be made. But money is sensitive, and in presenting the data, the Commission has been crystal clear that it doesn’t want to revise this funding policy. Nonetheless, the granular data can provide what is necessary: a better way to measure a good, regional, society.

How is Brussels doing? A bit of under-performance compared to Hamburg, Prague, Vienna, and similar regions. Source: European Commission/Social Progress Imperative

How is Brussels doing? A bit of under-performance compared to Hamburg, Prague, Vienna, and similar regions. Source: European Commission/Social Progress Imperative

The Netherlands’ first step to a happiness machine

In the three years I’ve been writing this blog, I’ve travelled around the world to explore happiness: from Denmark to Mexico and Bhutan, and from Costa Rica to the United States (well, the latter two only in spirit). But so far, I never wrote about my own home country, the Netherlands.

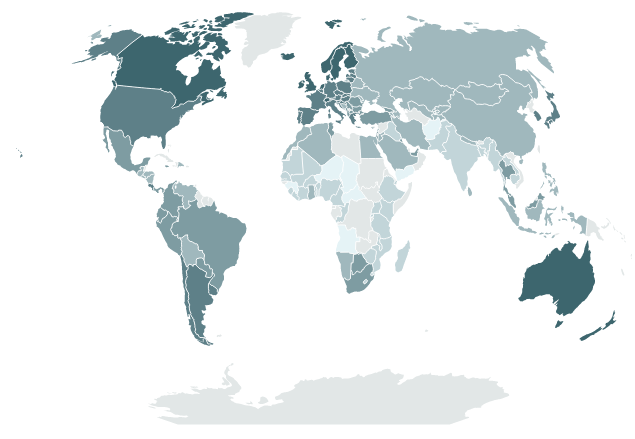
That’s not because there is no interesting debate on happiness in the Netherlands. The Netherlands always scores high in the international rankings (seventh in this year’s World Happiness Report, and fifth last year). It is home to the first Happiness Professor, Ruut Veenhoven. He was one of the first academics to seriously study happiness and his university hosts the World Database of Happiness (I’ve been told their team has identified 963 ways that have been used to measure happiness). A Unicef report often quoted in press demonstrates that Dutch children are the happiest ones of the (rich and developed) world. And beyond that, I’ve come across a lot of great projects on happiness, from happiness budgets for socially deprived people to happiness trainers and from happiness in civil community work to activists for environmentally sustainable happiness. The Dutch appear to be a happy few!

Happy people, happy state?

But does all this manifested interest mean in academia and society mean that also the national government is interested in understanding and enhancing the happiness level of its population? That is not the case. Prime Minister Mark Rutte famously stated that:

The State is not a happiness machine

What does Rutte mean by this? From the 1960s to the 1980s or even longer, many  in the Dutch political elite believed in the idea of socially engineered society, or in Dutch, the ‘maakbare samenleving’ (‘society that can be made’). This idea presupposed that government intervention could achieve a lot to improve people’s lives, the quality of society, and happiness levels. Over time, in the Netherlands like elsewhere the mood has shifted to a society where people are responsible for their own lives and the state does not interfere with people’s personal sphere. Happiness, or quality of life, is seen as a purely personal issue.

In my view, that is too simplistic. In the Netherlands like in Denmark, it just appears that we are getting many factors right. Neither Denmark nor the Netherlands has comprehensive happiness policies, but in both countries the quality of education, healthcare, social security, and trust are amongst the highest of the world. That is something to cherish, but rather than an endpoint, it should be something to build on.

Happiness through reports (or biscuits!)

Instead of developing a vision and a framework on quality of life – such as in Bhutan’s Gross National Happiness, but also in the UK’s government’s programme to measure well-being, the Netherlands has resorted to another strategy: happiness by reports!

It isn’t the only one to do so. The French Sarkozy government commissioned the appraised but never implemented 292-page report on the measurement of economic performance and social progress. The German Parliament outdid the French Committee: it published its own report of no less than 844 (!) pages on Growth, Wellbeing and Quality of Life).

Dutch 'stroopwafels' biscuits, a way to happiness? I'd probably subscribe to that view. Source: image found on Pinterest

Dutch ‘stroopwafels’ biscuits, a way to happiness? I’d probably subscribe to that view. Source: image found on Pinterest

The Dutch Committee ‘Broad Concept of Progress’

The Dutch response came this year. In April, a Parliament Committee published its own report ‘Broad Concept of Progress‘ (Breed Welvaartsbegrip), which it managed to keep just below 100 pages. The Committee set out in an exercise with three aims: to determine what GDP measures and doesn’t measure, whether there is value in broader concepts of progress, and to propose what these concepts should look like.

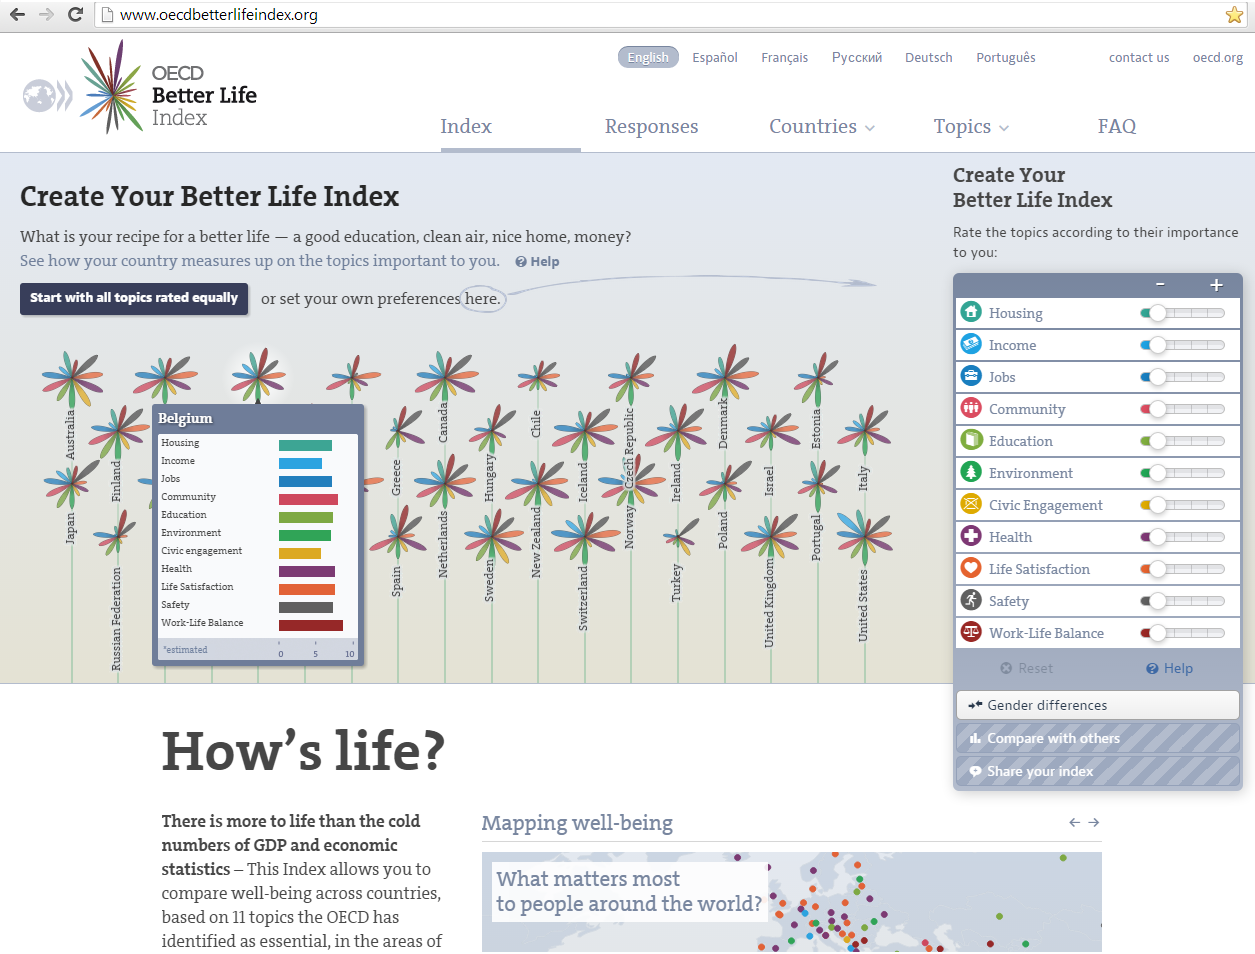
The Committee does see value in using broader concepts, and evaluates international efforts, like the OECD’s Better Life Index, the EU’s Beyond GDP agenda, or statisticians’ guidance aiming to measure subjective well-being in a more harmonised way. At the same time, it acknowledges the efforts are still very divergent. The report also points the work in the Netherlands itself via the Monitor Sustainable Netherlands (Monitor Duurzaam Nederland) prepared by the Dutch Statistical Office and three advisory bodies.

Monitor wellbeing broadly

Ultimately, the Committee does not make a clear choice in answering the question how progress should be measures. Instead, it comes with three recommendations. Firstly, to broaden the Monitor Sustainable Netherlands to turn it inot a Monitor Broad Wellbeing, and provide annual updates of the level of general wellbeing in the Netherlands. Secondly, these annual reports shouldn’t end up in a drawer or the fireplace, but be debated with the government in a parliamentary debate. And finally, the Dutch government is called to contribute to the convergence of all various international efforts in wellbeing indicators.

The report doesn’t contain a great ambitious vision, but aims to set a pragmatic and practical agenda. In a debate with MPs today, the Committee seemed to have support for this approach. Hopefully, the Netherlands is making a good choice today. There’s merit in not entering too deeply into the ideological discussions on metrics, as these often arise in arguments of the kind of ‘my index is better than yours’. Instead, by putting the issue on the agenda annually and contributing to find an end in the international labyrinths, the Netherlands may slowly edge closer to develop a vision on happiness.

A trip of one thousands miles to happiness starts with the first step. Even if the Dutch state won’t be a happiness machine anytime soon, it has started a journey.


Juggling yellow stress balls – my message to the Foro Bienestar conference

What serious message can a tiny, bright yellow, stress ball with a smiley convey?

Last week I shared a couple of lessons I learnt from other speakers at the well-being and development conference in Guadalajara. Today, I wanted to tell you about the points of my own presentation.

Juggling a yellow stress ball

The panel I was on had the title ‘what is the role of governments in happiness of the people? I used this little yellow ball to illustrate my message. I realised that many participants were triggered by these little balls in their welcome pack. Some people took pictures of them, holding them in front of their face or their bag and tweeted them. Probably, others just left them in a corner or threw them away. And myself, I decided to juggle with them at the beginning of my speech.

Is there a message in (very poorly!) juggling with stress balls?

I argued there was. My point was simply: everybody will use tools you give them in a different way. You can bring a horse to the stream, but you can’t force it to drink. Sometimes a horse just wants to splash the water!

It’s the same with public policies: as a government you can design policies that you hope make people happier, but you can’t control how they will react. Still, I think there is large responsibility for governments to create the underlying conditions in which citizens can strive. Long-term well-being and quality of life combine subjective elements (our emotions, how we react to circumstances) and objective elements (the  environment we live in). This environment is partly shaped by governments’ economic, environmental and social policies. If good or bad choices are made, that will ultimately influence the quality of our lives.

In the speech, I tried to give my own ‘little stress balls’, or methods to enhance quality of life. I made three suggestions to the policy makers in the room:

Integrated measurements of well-being

Firstly, I advised them to carefully measure the well-being in their jurisdiction. Well-being indicators from all areas – economy, environment, social affairs, health, education, and others – should be measured together, rather than in isolation. Now, in most countries, GDP is the main metric that is used in public policy. I argue that a dashboard of several indicators, such as in the OECD’s Better Life Index, is a good tool to have an additional layer of information. As such, policy makers can detect in which area improved policy outcomes can win the most in terms of quality of life. This can help them to focus their resources on the areas where they can make the biggest difference.

jb at forobienestarTreat well-being as a political agenda

Secondly, I suggested to treat well-being as a political agenda like any other. If the focus will be more on quality of life and well-being, and less on purely economic growth, that is a massive shift in policy! Administrations know that they have to communicate all their policies to citizens and engage in a public debate to explain the choices the made. This applies to well-being just the same as to other areas.

It starts with happiness at work

Thirdly, I advised to also look at the happiness at work of staff in the administration. Motivation and job satisfaction at an individual and team level massively affect the success that an administration will have in the implementation of it its policies. Surveys can be used to monitor and improve work satisfaction and working conditions of the staff responsible to deliver the well-being policy objectives set by politicians and policy makers. Only happy staff can create happy citizens.

Now it is to the administration of Jalisco to translate the lessons from me, and all other speakers, into new and better policies. To be continued!

(and next week, I’ll face one of the other questions debated on the conference: why are Mexicans so happy?)

yellow balls

Beyond GDP, a long road to travel

Almost fifty year since the famous speech by Robert F. Kennedy, and almost ten years after the start of a thorough debate on ‘beyond GDP’, it’s time to meet the unfilled promise.

On some occasions before, I have written blog posts to encourage EU policy makers and politicians to step up their ambitions and integrate ‘beyond GDP’ indicators in their policies. For instance, see posts on ‘Gross European Happiness‘ or ‘An EU Happiness Manifesto‘, and an essay I wrote for the Next Generation for Europe magazine NGE Magazine 1 (Chapter three, pdf).

And I must say, the topic is on the agenda. I recently had the fortune to attend a European Commission expert conference on ‘beyond GDP’. Noting the importance of the topic, the conference was opened by two outgoing Commissioners: Laszlo Andor, for Social Affairs, and Janez Potocznik, for Environment.

Winning the battle of measurement…

How to make the giant leap from theory to practice? Enrico Giovannini, a former Italian Minister and OECD Chief Statistician, has pushed the debate on GDP forwards in the recent decade. He asked whether those supporting the idea of beyond GDP have won or lost in the debates from the last years. His conclusion was that the ‘battle of measurement’ has been won. In comparison to ten years ago, national statistic offices do a lot more effort to measure what matters.

Routine measurements of social and environmental indicators allows us to get a broader understanding of quality of life than economic growth and inflation could give us. They are more and more interested in collecting and refining social figures on employment rates, NEET rates (people Not in Education, Employment or Training – a proxy for youth employment), and inequality-adjusted GDP growth. Environmental numbers like generated waste, emission of green house gasses and water use also gain more prominence. And new indices like the OECD Better Life Index treat all indicators equally.

OECD

Screenshot of the OECD Better Life Index website

… but the battle for policy must still be fought

There are two questions around this: do we measure enough? And do we do enough to exploit this massive amount of data and adapt our policies to it? When asking whether we won the battle of policy, the answer from Giovannini is simple – no. If you want to make simple policies from these crunched numbers, you have to make trade-offs. How much air pollution is an increase in GDP of 1% worth? How much fossil fuels can you burn to lift one thousand people out of poverty? And what, objectively, is well-being anyway? These are incredibly difficult questions to answer. Economic growth is a lot easier objective. There is no easy way out.

Can economic, environmental and social betterment go hand in hand? The Commission – via its stated objective of smart, sustainable and inclusive growth – thinks so. But MEP Philippe Lamberts doesn’t agree. He believes that in a finite planet, sustainable growth is an inherent paradox. From an environmental perspective, we may need degrowth; but at the same time, that has consequences on employment. And, higher growth is also associated with more money invested in environmental protection.

How do you cut this Gordian knot?

The quest for perfection limits action

Nobody can easily answer these complex these questions. But I can offer my own conclusions:

  1. A lot of laudable work is being done by statisticians and policymakers, especially in social and environmental departments. With a lot of conviction and passion, they had managed to put the issue on the agenda. But they need to get economists more involved in these debate to get more leverage. It was telling that very few participants were trained economists.
  2. Call me a pessimist, but my feeling is that the political momentum behind the beyond GDP drive is fading. There are generic references to the agenda, but the policy efforts needs to be stepped up. In my view, policymakers need to be more courageous and bring their policies to main stream politics. That requires broad political campaigning and communication, as the new economics foundation also writes (pdf). Reports don’t change reality. Action does.
  3. Finally, maybe it is a quest for perfection that is limiting action. A perfect measurement of well-being does not exist. If you group indicators together in one figure – say well-being is ’42’ – you can make little sense of it. Similarly, a ‘dashboard’ with eleven different figure as in the OECD Better Life Index can be difficult to apply. But in this case, it appears the perfect is the enemy of good. GDP also has been refined often. It’s better to refine measures and policies of well-being on the way than to never start the journey.

Beyond GDP: a long road to travel, but one that is worthy to go.