Tag Archives: The Netherlands

A practical study of happiness in Turkey

What does happiness look like in Turkey?

That’s the main question I dived in during a few days in Istanbul two weeks ago, as I spoke at a conference on Determining the Happiness Map.

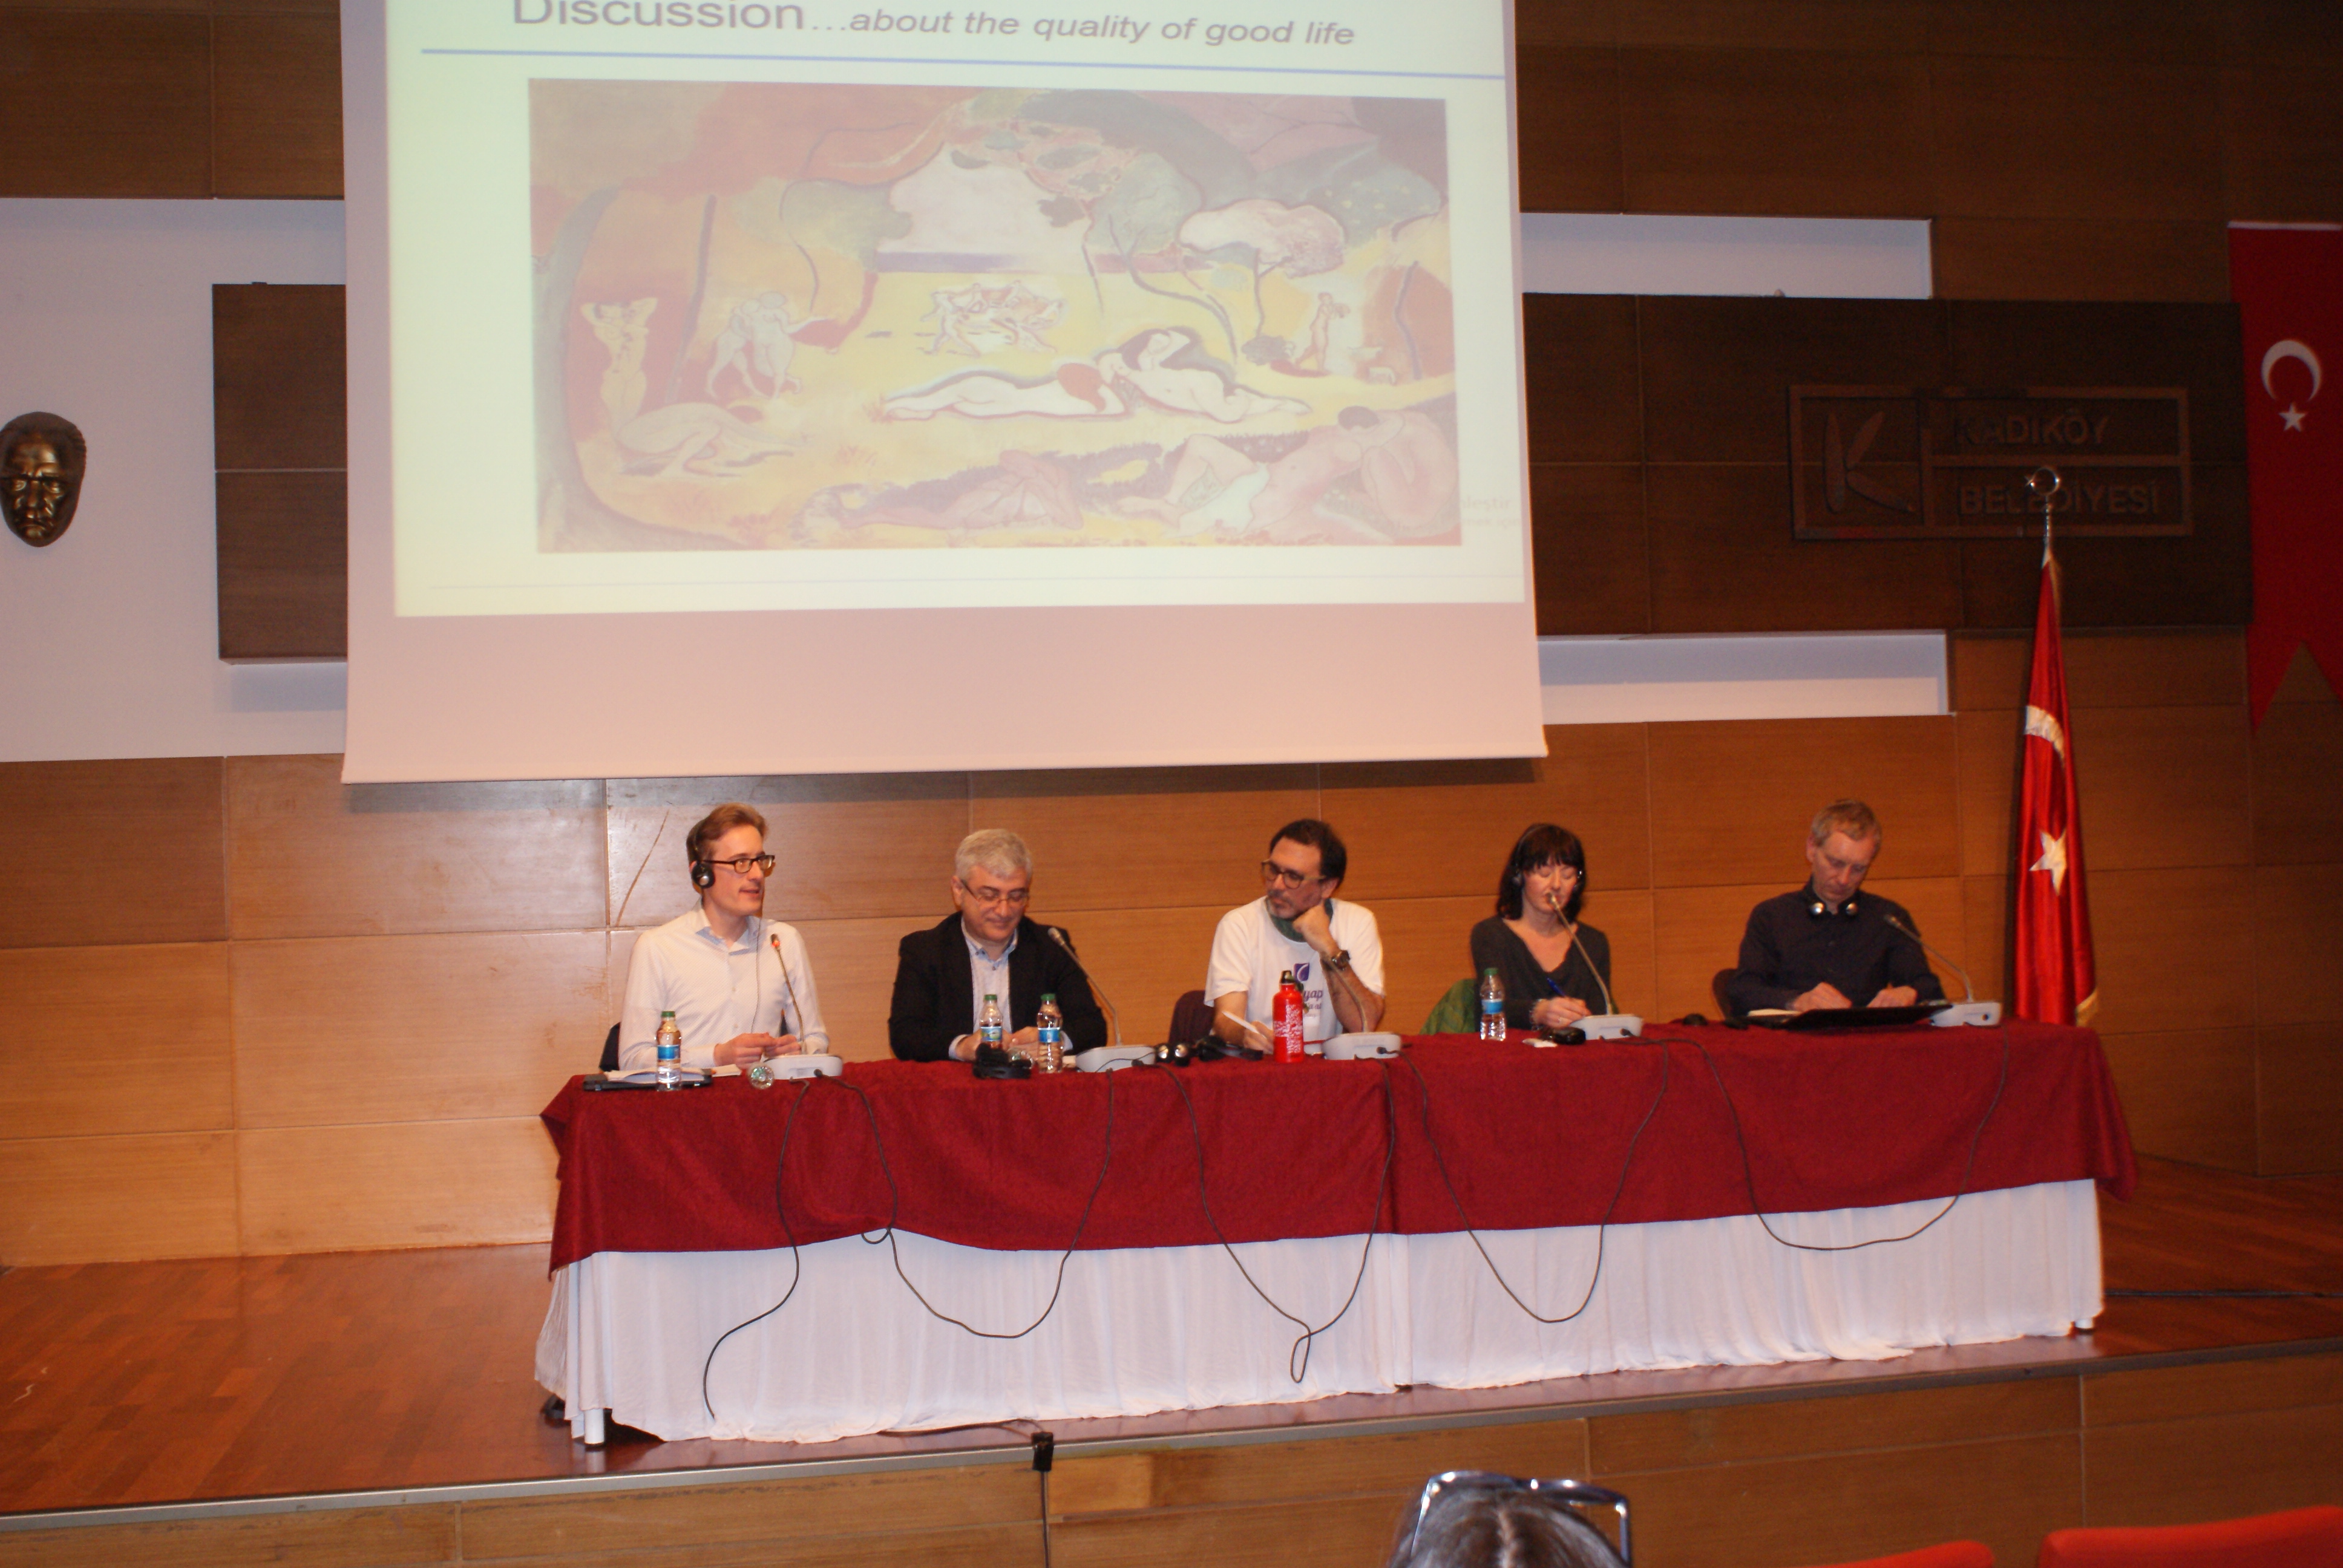
At the conference, hosted by Tüses and Kadıköy municipality, I spoke alongside professor Erhan Dogan (Marmara University Istanbul), Ragnhild Bang Nes (Norwegian Public Health Institute and Oslo University), and Jochen Dallmer (University of Kassel).

Happiness in Turkey

It’s a funny idea to have researchers from cold Northern countries like Norway, Germany and Netherlands come to Turkey to speak about happiness. Many of our chats on happiness focused on the relevance of good weather, tasty food and the street life culture for happiness. While all of those are present in Mediterranean Istanbul, they’re not factors that North-West Europe is known for.

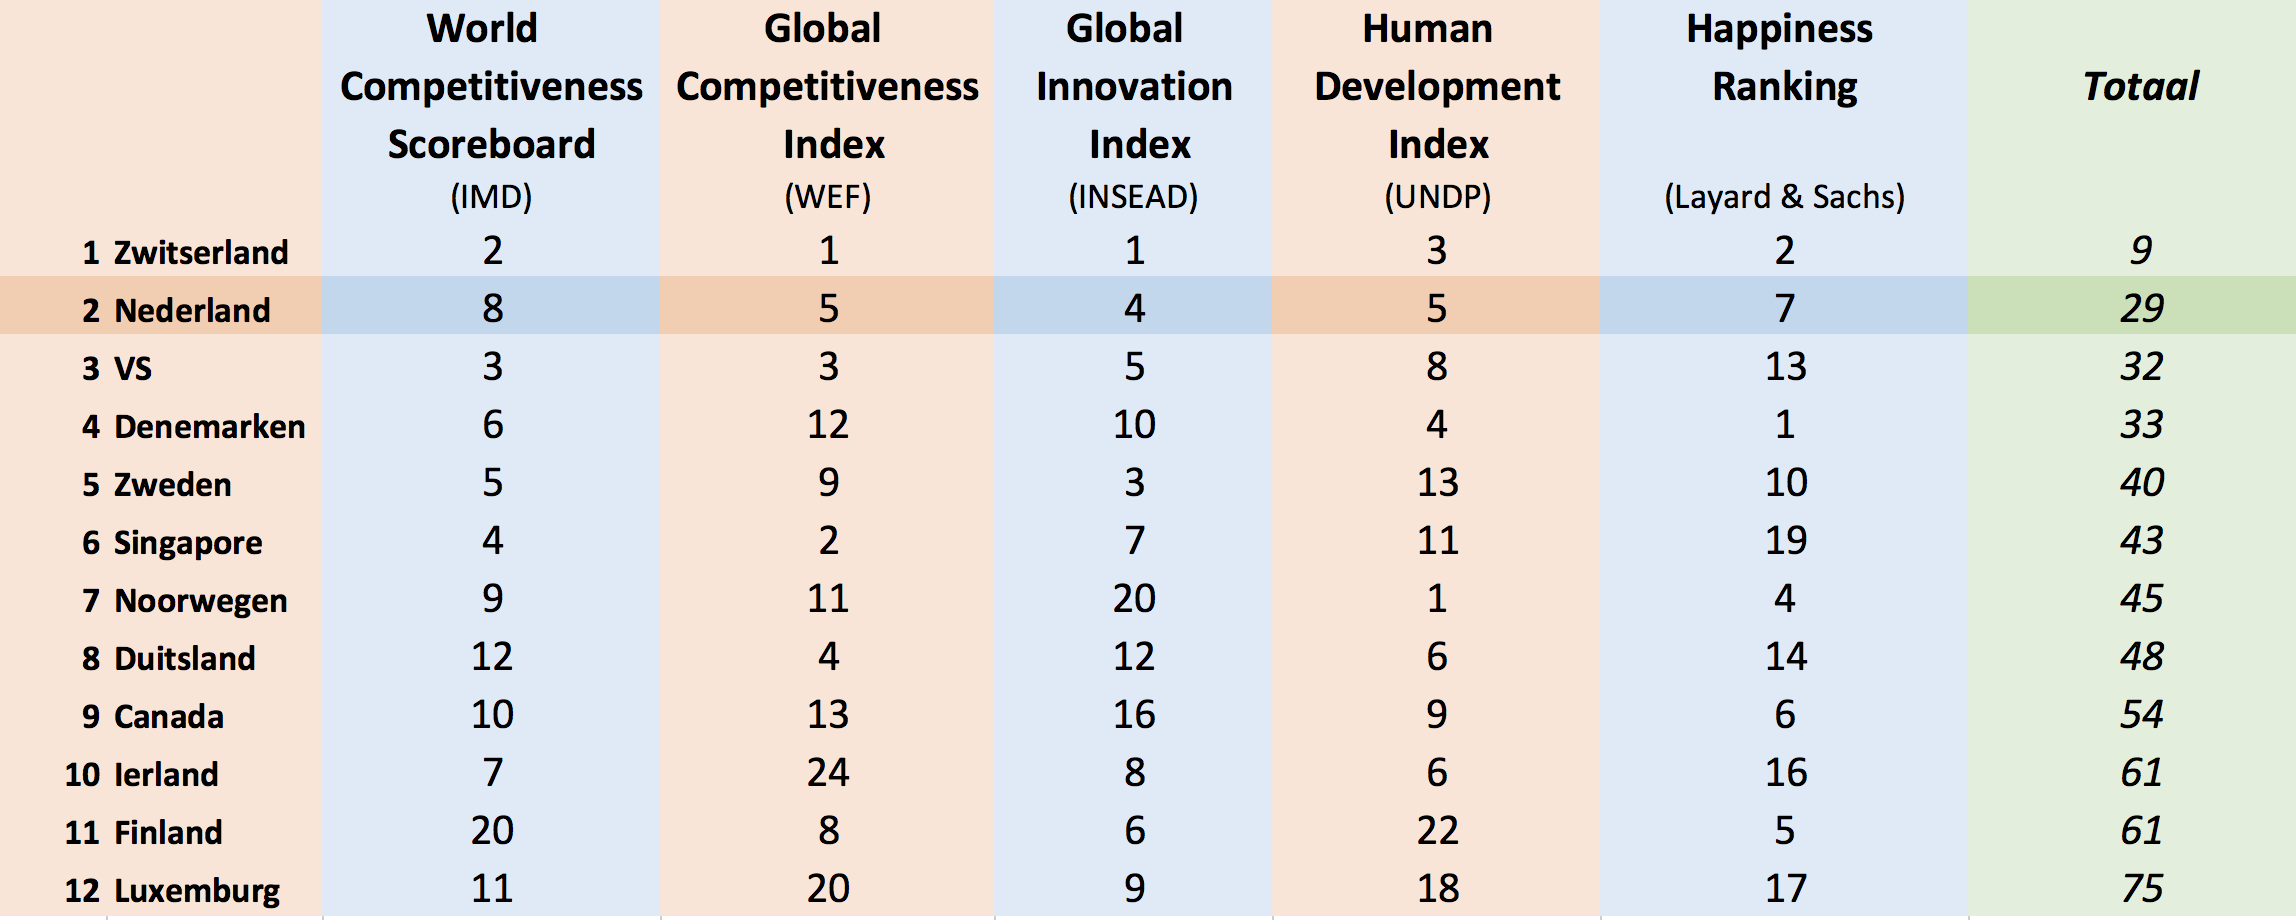
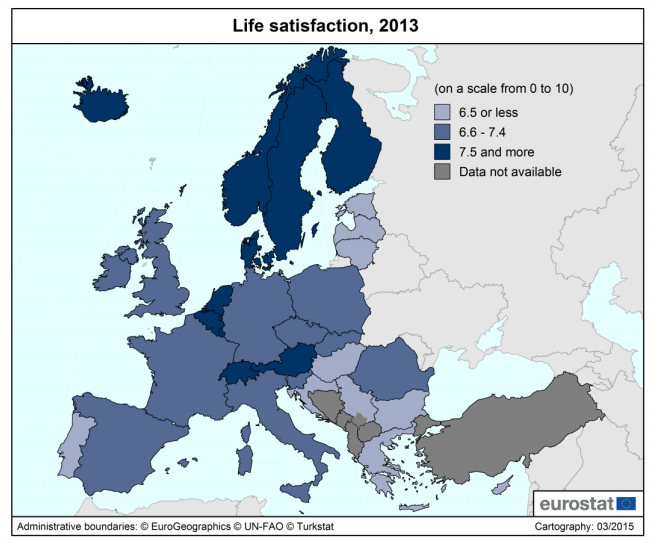
That factor highlighted one of the interesting elements we came to discuss: happiness and quality of life are not the same. While Turkey may have a warmer temperature and a Mediterranean cuisine on offer, some of the key features that contribute to quality of life are less prominent. Norwegians may or may not enjoy themselves more than Turks, but perform well on loads of factors that matter: high incomes, a strong collective social support mechanism, and personal freedom.

How much work do we need to do in life?

A few takeaways from the conference:

  • Turkey’s level has increased over the years. In the 2017 World Happiness Report, Turkey scored about 0.3 points higher (for 2014-2016, compared to 2005-2007). According to prof. Dogan, the factors of GDP and social support are most prominent in explaining the level of quality of life. In that matter, Turkey is quite similar to many other countries. To the contrary, only a relatively small part of the happiness level is explained by generosity. Correlation of course does not equal causation, and there is no direct causal relation, but nonetheless there might be a case to promote generosity!
  • In Norway, the qualify of life is high, resulting in a 1st spot in the World Happiness Report for 2017 (though it was overtaken by Finland in the 2018 edition). But that doesn’t mean all is well. According to Bang Nes, suicide rates in Norway stand at around 11 per 100,000, almost triple the 4 per 100,000 in Turkey. At the Public Health Institute where she works, efforts are made to better understand how people live longer and healthier lives. Better data on happiness and mental health are collected, in order to guide public policy.
  • My third fellow speaker, Jochen Dallmer, looked at the German public debate on quality of life, and especially the role of sustainability. His PhD research is about a complicated question. We know that we should change our lifestyles to get back in the boundaries of the single planet we have. Happiness now is often associated with hedonic pleasures. Could an ascetic lifestyle provide happiness? He also posed another very un-German question: how much work do we need to do in life? And finally, he spoke about the German quality of life data collection, which he felt mainly conveyed high quality/standards.

DSC03590

My own 20 minutes of fame: happiness in the Netherlands and Poland

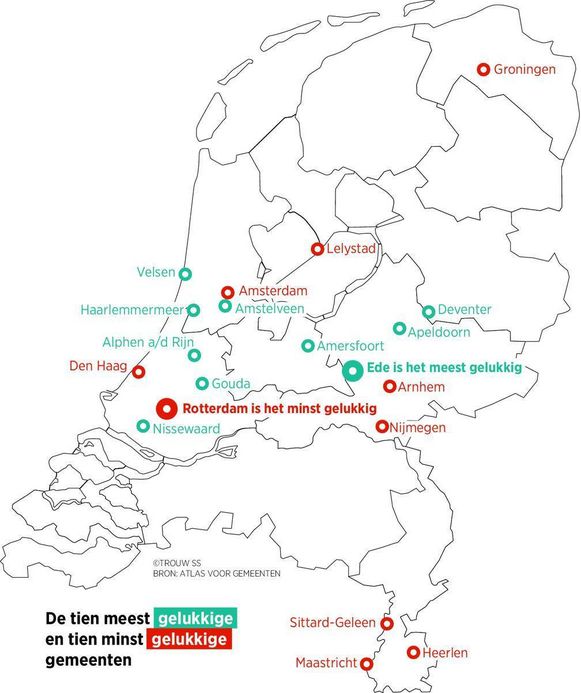
  • Finally, my own 20 minutes of fame were dedicated to the development of happiness levels in Poland and the Netherlands over the last 25 years. Dutch happiness level stayed broadly stable, and slowly a more active public debate on well-being policies is emerging. Until the elections of this month, the municipality of Schagen had a Councillor for Happiness (with Finance as his primary portfolio). And similar to the Norwegian and German efforts, a new Broad Wellbeing Monitor mapping happiness is being shaped after a hesitant start.
  • Poland has seen massive transformations since the 1990s, and also the domain of happiness has not been left untouched. Even with social ineqaulity rising, happiness levels icnreased, likely in connection with tremendous economic growth. But also Poland shows awareness that there’s more than work and GDP. The Pracuję bo lubię (‘I work because I like it) project is one example taking happiness as inspiration.

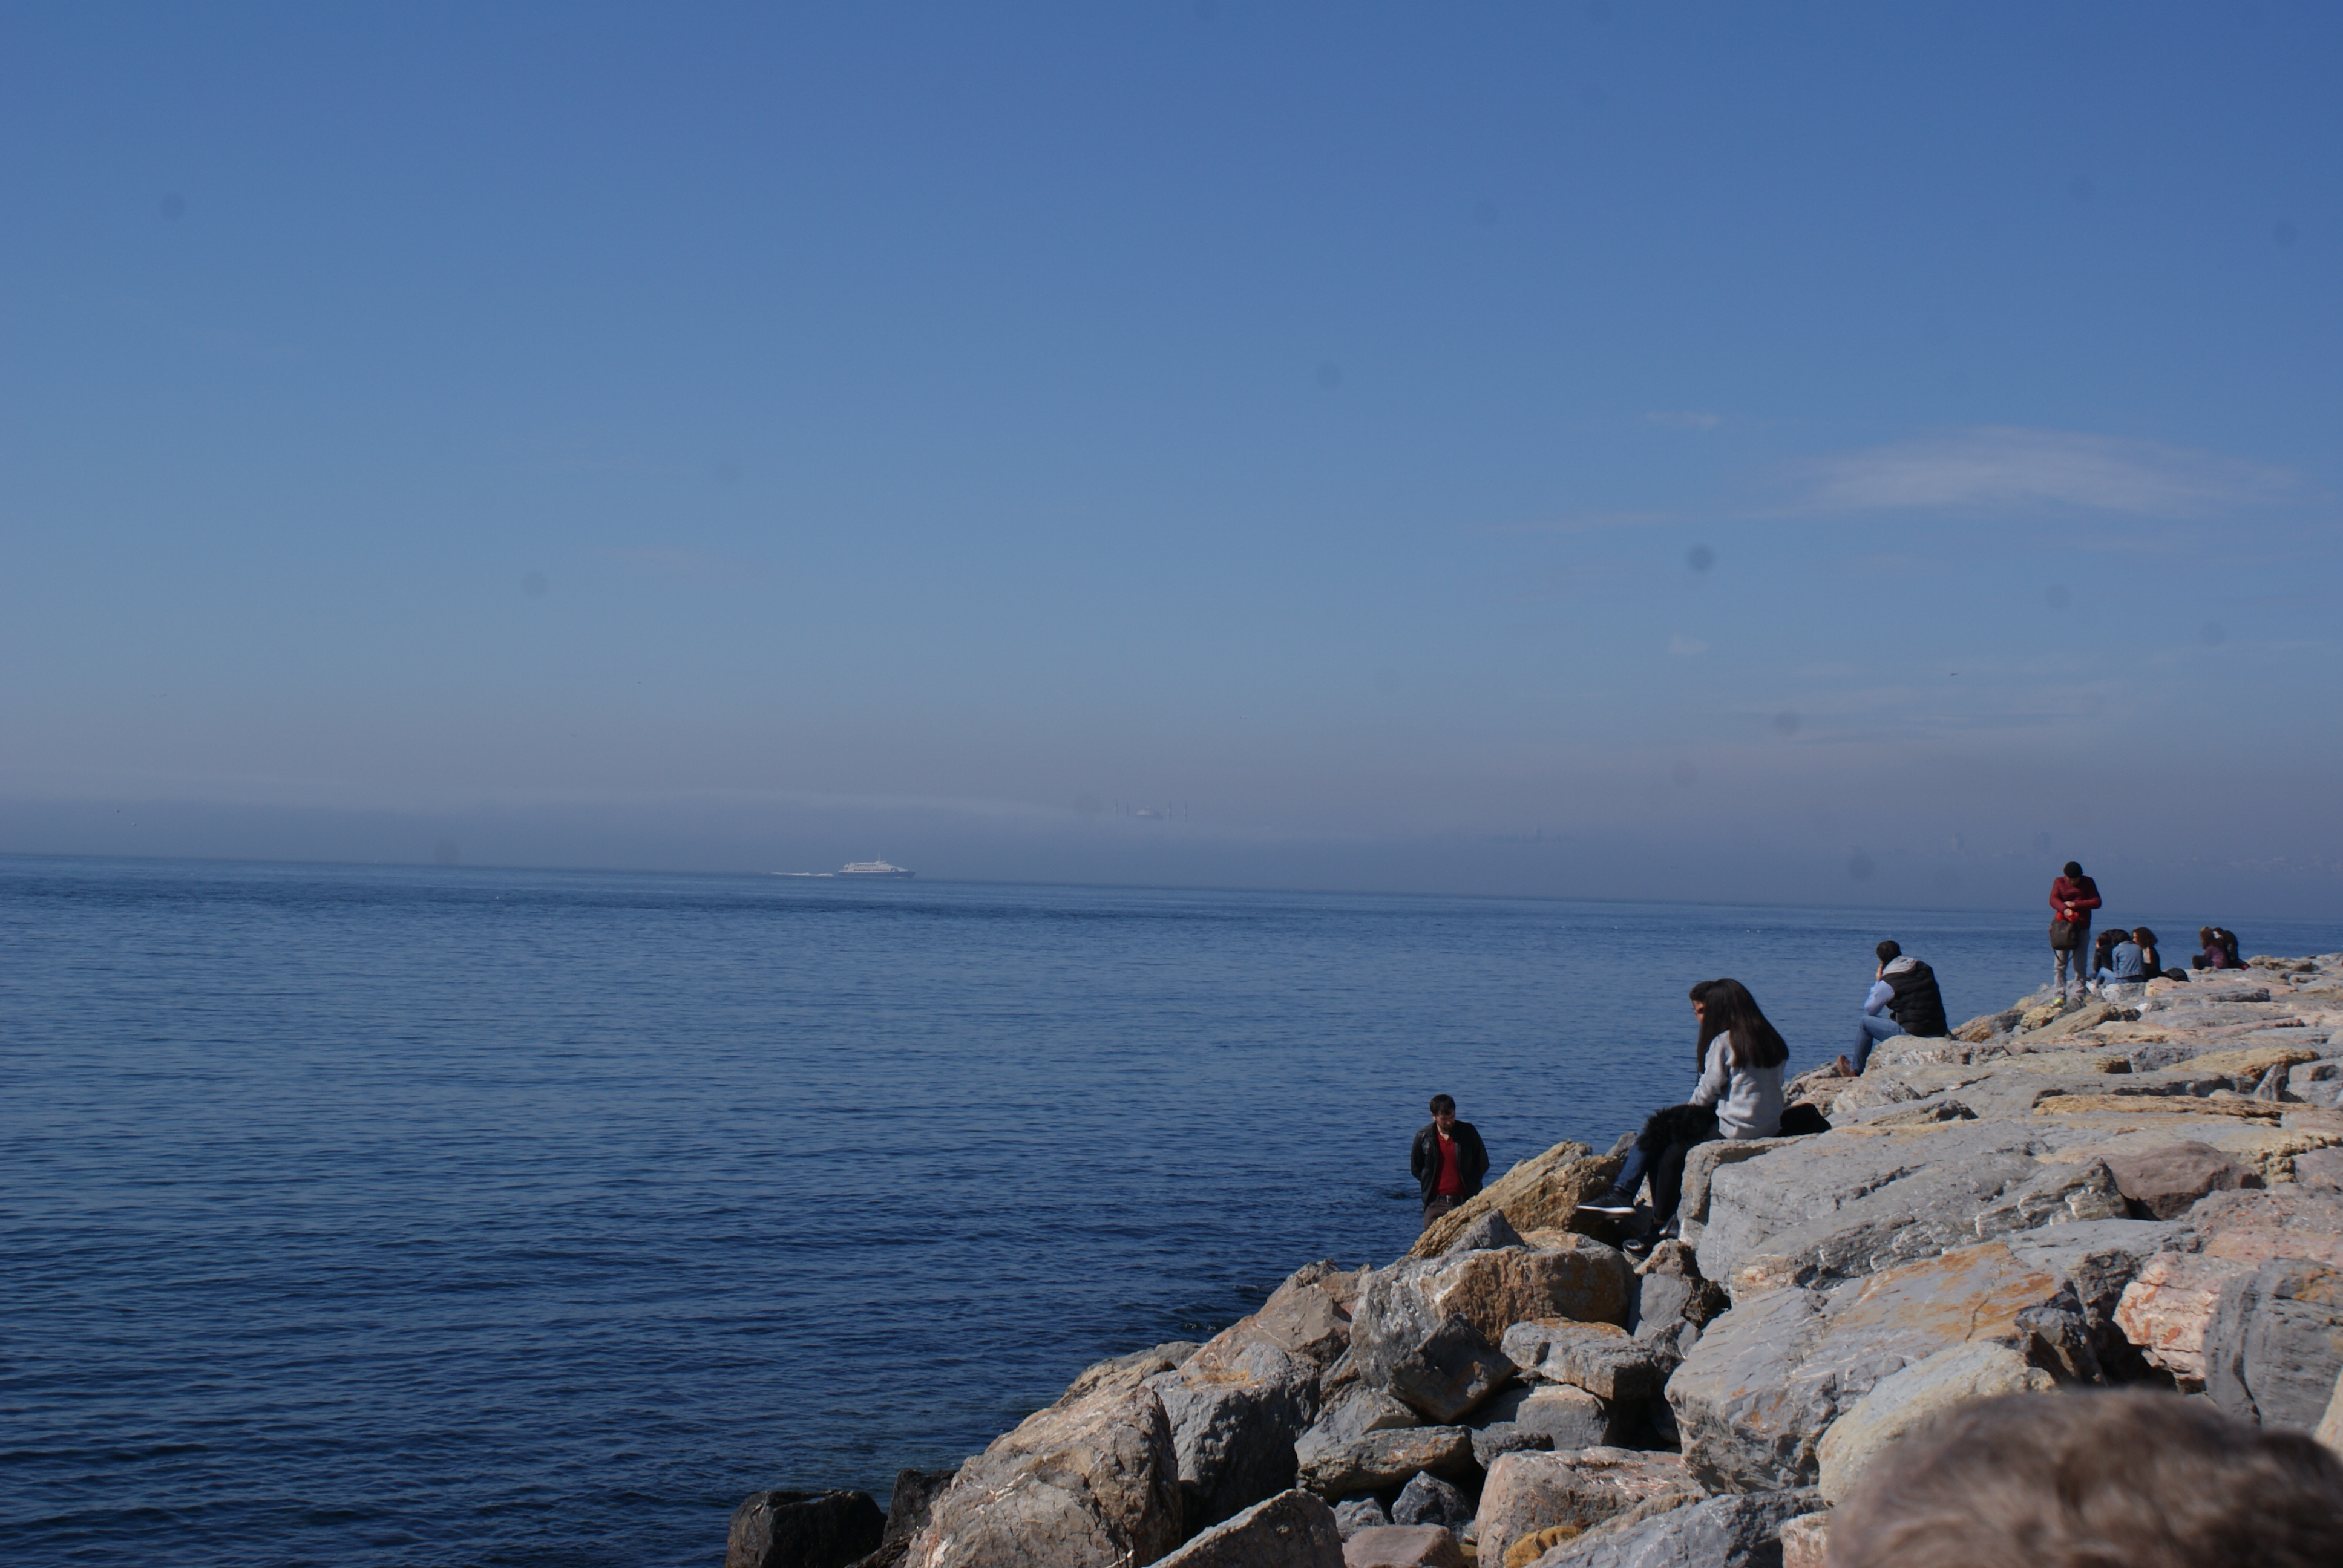
And my own happiest moment in Turkey? A lost Sunday afternoon hour in company of old and new friends, spent basking in the sunlight with a view on the sea of Marmara.

DSC03648

The Netherlands: small happy cities in a ‘madly cool country’

The population of the Netherlands is two-faced. When we are among ourselves, we like to complain: about our politicians, the weather, taxes, the healthcare system, declines in fixed jobs, and immigration. In this year’s elections, parties with populist policies won over 25% of the vote.

While we tend to be pessimistic about society as a whole, most people are very satisfied with their own lives. Despite our complaints, the Netherlands is one of the happiest countries of the world. Indeed, when we speak to foreigners, we paint a proud picture of our country. We speak of the Netherlands as a country that is hard-working but not too serious, innovative, well-organised, and with high standards of life. PM Rutte’s daily job is to tell Dutchmen they live in a ‘waanzinnig gaaf land’, which means something as a ‘madly cool country’. A Financial Times feature just before the elections broadly supported the claim.

Indeed, if we look at the stats, it is fair to say ‘The Netherlands second’, as the viral video presenting the country to President Trump did this year did. Dutch economist Mathijs Bouman mapped the Netherlands’ performance on a range of indicators, comparing various rankings on competitiveness, innovation and human development. His conclusion? The Netherlands is the best country of the world, second only to… Switzerland. Only when the World Happiness Report was added, the Netherlands jumped over the United States to second place.

The Netherlands second. Source: Mathijs Bouman, http://mathijsbouman.nl/nederland-is-het-beste-land-ter-wereld-op-zwitserland-na/

The Netherlands second. Source: Mathijs Bouman, http://mathijsbouman.nl/nederland-is-het-beste-land-ter-wereld-op-zwitserland-na/

Happiness: the last frontier

With good scores on so many levels, it is time to reach the last frontier: make society even happier. And the Dutch are getting to business: over the last years, society’s happiness and alternative indicators have gained more attention in the Dutch public debate. Last year, the Dutch Parliament supported steps to create a ‘Monitor Broad Well-being’, to better assess quality of life in the Netherlands.

A happiness atlas

Researchers and marketeers are also spending time on the topic. Recently, a study crowned the central Netherlands town of Ede the happiest city of the Netherlands.

The Atlas of Municipalities, prepared with the support of the Happiness Research Centre of the University of Rotterdam, compared happiness levels in the 50 largest towns. Mid-sized towns like Ede, Apeldoorn and Gouda rank to the top, while most of the larger cities like Groningen, Amsterdam and The Hague are on the bottom of the table. Rotterdam, the second-largest city, even closes the list of 50. The map below outlines the top-10 in turquoise, and the bottom 1o in red.

This map shows cities ranked 1-10 (in turquoise) and 41-50 (in red) in the Atlas of Municipalities. Source: Trouw, based on data of the Atlas. https://www.trouw.nl/home/het-geluk-is-te-vinden-in-een-middelgrote-stad-ede~aeb4553a/

This map shows cities ranked 1-10 (in turquoise) and 41-50 (in red) in the Atlas of Municipalities. Source: Trouw, based on data of the Atlas.
https://www.trouw.nl/home/het-geluk-is-te-vinden-in-een-middelgrote-stad-ede~aeb4553a/

What is happiness, anyway?

Let’s dig in a little bit deeper into what this all means. First of all, what is happiness anyway? For the purposes of the study, it is “the extent to which an individual find satisfaction in their own life as a whole”. ‘Happiness’ is then measured via three metrics: an overall judgement of a respondent’s life satisfaction as a whole, the extent to which one is a happy human being, and the extent to which one felt happy in the last four weeks. Ede overall scored best at this, with 89% of the local population scoring at least an average of 7 out of 10 among the three.

Second, how is Ede different than others? The researchers identified seven factors that account for the differences in happiness levels across Ede and the other cities. These, include the size and composition of the population, the employment rate, health, religion, and the attractiveness of life in the city. That however doesn’t mean that Ede is the only city doing well on those factors, or on happiness. Overall, smaller cities tend to perform better than bigger ones: here, life is less chaotic, while there is more on offer than on the countryside.

Marginal differences

The differences between cities appear quite marginal and probably are not statistically significant. 17 out of the 50-sample score 88 or 89%, no fewer than 42 are in the 85-89% bucket, and even number last Rotterdam houses 82% of happy people. As such, the meaning of being ranked first, second, or even thirtieth, is fairly limited.

Other indices in the Atlas convey this point even more. The happiness index is only an annual theme of the Atlas, which annually compares cities on a range of metrics. Some of these metrics are pooled into indices, for instance mapping ‘attractiveness’ and social-economic performance.

The ‘attractiveness’ index aims to compare how attractive cities are as a place to live for the Dutch population. It looks at factors such as the jobs within range of the city, the share of owned and pre-war homes, distance to nature, and the culinary and cultural offer. The social-economic index, as the name says, looks at elements like employment, the population share on welfare and with low education levels, and the poverty rate.

Both rankings offer a radically different overview than the happiness ranking: ‘Happy’ Ede finds itself back at the 15th place as for its social-economic performance. ‘Unhappy’ Rotterdam is found a more attractive place to live than Ede (respectively 17th and 22nd on the attractiveness index).

Spotting strengths and weaknesses

The takeaway? Indices help to spot cities’ strengths and weaknesses, especially when you dig in the underlying data via the OECD-type dashboard approach the Atlas offers. But different measurements give different results. While it is fun to publish such rankings and see how our cities perform, one cannot a lot of value to small differences or annual movements in the Netherlands. And the key message remains that life in the Netherlands is good. We can be among 82% of happy fellow citizens, or among 89% in Ede. In this sense, the Dutch do live in a ‘madly cool country’, as Prime Minister Rutte said.

How happy are we actually in Europe?

Did you feel particularly good last Friday? Maybe you enjoyed #Eclipse2015 as so many others did. Or you felt great because the world was celebrating the International Day of Happiness!

The International Day of Happiness was instituted by the United Nations in 2012, as I wrote last year. I must say that beyond a flood of tweets, I haven’t seen too many official events this year. The exception however was a very interesting data set from Eurostat that answers how happy we actually are in the EU.

I’ll come with the answers soon. But let me first give an idea on how we actually measure happiness.

How do you measure happiness?

There are practically three ways to measure happiness:

  • “Overall, how satisfied are you with your life these days?” With this question, people are asked about their overall quality of life or life satisfaction. There can be a little bias there – I might answer something different today than I would tomorrow. But the experience of researchers is that these biases cancel each other when the sample is large enough.
  • “How much of the time over the past four weeks have you been happy?” This question instead measures positive affect, or people’s happiness level on an emotional rather than on a more rational level. It’s based on the idea that beyond the overall life satisfaction, the presence of positive emotions and the absence of negative emotions is a good indicator of how a person really lives. 
  • Finally, there is ‘eudaimonia’, ‘eudaimonic happiness‘, or ‘meaning of life‘, which has a less clear-cut question. Eudaimonia broadly refers to the value and purpose of life, important life goals, and for some, spirituality. This requires a bit more reflection before it is answered.

Eurostat’s results show that the three measures are correlated at country level and at individual level, with some exceptions. A high level of positive affect is correlated with high life satisfaction and meaning of life. Still, one out of fourteen is ‘happy all of the time’ but with a low level of life satisfaction!

The good news: how happy are we?

There is a lot of good news in the figures:

  • 16 out of 28 countries have an average above 7.0, and the EU average is 7.1 out of 10
  • The highest level of happiness is found in Denmark, Finland and Sweden, with 8.0. The Netherlands and Austria score an 8.
  • On average, young people (16-24) score highest, at 7.6. The outliers are the Austrians: 8.4!
  • In Finland (8.3) and in my own home country, the Netherlands (8.0), the highest bracket is the age group 25-34. Does that mean that statistically, I will never be as happy as I am now? (The answer is: no. The study explains there can also be a ‘cohort effect’ – a group of people could retain the same happiness level, independent of their age group.
  • And the happiest are… Danish seniors! The absolute highest number is found in Danes in the age of 65-74: 8.6, and 0.7 higher than the 50-64 group in Denmark (7.9). There must be something amazing about retirement in Denmark!
  • There is only a marginal difference between men (7.1) and women (7.0). Also, there are slightly more women in the highest category. And controlling for differences in income, marital status, and labour market position, women are happier.
  • 42.1% of Danes scores above 8, and only 5.6% of Dutch score below 6. This might actually be the most important outcome: when it’s about happiness, it is not only the average but also the distribution that should count. In these two countries, happiness seems to be distributed fairly equally.

The bad news: how unhappy are we?

But there also is a bit of bad news in the figures:

  • Generally, happiness levels tend to decline with age: from 7.6 (16-24) to 6.9 (50-64), before making a little rise to 7.0 (65-74) and a further decline to 6.8 (75+)
  • Bulgarians and Serbians appear to be quite miserable: they score averages of 4.8 and 4.9. In Bulgaria, every age group is below 6.
  • Unemployment buys unhappiness. The difference between full-time employment and unemployment is 1.6 points (7.4 vs 5.8).
  • There is also a strong relation between poverty and unhappiness. Only 7.5% of materially deprived people has a high level of life satisfaction. And deprivation of important needs (ability to pay rent, to keep the home warm, a holiday or a car) has a larger negative effect on happiness than poverty in monetary terms.

The full analysis from Eurostat is available here.

Picture 3

Football & happiness: the feelgood factor of Van Persie

Whether you are a football lover or football hater, you will have noticed that the World Cup has started. Time for me to ask the question: do good performances make countries happier?

Let me take a – randomly selected – example. As a Dutchman, my expectations ahead of last Friday’s match against Spain were very low. We had lost the World Cup final against them in 2010. Spain’s selection contains a list of stars that rivals any team. Their team is experienced, having won three tournaments in a row: no match for our defense on young and unexperienced players.

How wrong we were!

The match turned out to be one of the best stories of Dutch football ever written. In the first half, the Orange Clockwork started slow. After an undeserved penalty, Spain led 1 to 0.

But just before half time, when we already had given up on our chances, something majestic happened. Daley Blind, at the left side of the field, gave a long pass, and the new Flying Dutchman Robin van Persie scored a goal that will go into history as one of the most beautiful ones ever: 1-1.

And this was just a start. The Dutch team – and fans everywhere – went crazy. Arjen Robben: 2-1, revenge for the lost final 2010. Defender Stefan de Vrij, after a scrimmage in front of the goal: 3-1. And Van Persie and Robben went on to score an improbable 4-1 and 5-1. The feeling was amazing. The beer was good. The girls in orange dresses were pretty. Even Dutch music of poor quality was good enough to sing along to. Viva Hollandia! And the good feeling persists. Waking up the next day – with a collective hangover – the result was still the same. 5-1. We beat three time champions Spain 5 to 1!


I guess one can safely say: yes, football results affect the collective well-being of a country. But beyond strong anecdotal evidence, let’s see what academics say about it. Indeed, there are several academic and popular-scientific studies about this question of life and death.

The host advantage

In their book Soccernomics, Simon Kuper and Stefan Szymanski show that hosting a World Cup increases happiness levels in a country until several years after the event. National pride increases when visitors from all around the world are received in the home country. However, this effect does not appear in Brazil, where many people strongly oppose the World Cup. Street art protests dot the walls of their cities, and even the 3-1 win against Croatia, courtesy of the referee, on the opening night seems to have done little to increase the mood.

Brazil World Cup

Suicide and strokes

Kuper and Szymanski also show that stories about increasing numbers of suicide after dramatic losses are a myth. To the contrary, World Cups are social events involving the entire community, including depressed people. But football does carry a health risk: matches can create stress and thus contribute to heart attacks. A study, in a scientific article with the improbable title “A matter of life and death: population mortality and football results”, found a correlation between heart attacks and home defeats: male supporters of the English teams of Newcastle United, Sunderland, Middlesbrough, and Leeds United are more likely to die from a stroke when their team loses in its own field! For instance, in Sunderland, stroke deaths increased by 66% in men when Sunderland AFC lost at home.

Today it matters, tomorrow it doesn’t

Another study by Kavetsos and Szymanski finds that the impact of sports success on happiness is mainly short term, and not statistically significant in the longer term. Beyond the home nation advantage, a second positive effect appears when a team, like the Netherlands on Friday, beats the expectations. But rather than a long-standing legacy effect, football results only are a positive feel-good factor for a short time. This also confirms the finding of a seminal study concluding that whether you win the lottery or end up in a wheelchair today, your happiness level is the same in one year time.

Whether you win or lose, in three months it doesn’t matter anymore, claims psychologist Dan Glibert. But I live today, and not in three months from now. And today, I am happy.

Today, Robin van Persie and Daley Blind provide sheer happiness.

RVP

The Happy City: lessons from Bhutan

I wrote this article for Stadsleven (“City Life”), an Amsterdam-based talk show about urban issues. The next session on 27 January will be dedicated to the Happy City, and the editor of Stadsleven asked me to explain what our cities can learn from Gross National Happiness (GNH) in Bhutan. The original Dutch version can be found here.

Bhutan-Happiness-is-a-Place-logo-2011-small

What is the objective of the state? Philosophers and leaders have been reflecting about this question for thousands of years. Most states focus their policies on economic development. The assumption is that when a country becomes richer, its citizens will be better off. But is that the case? Research shows that the Western world is a lot richer than fifty years ago. At the same time, we are hardly any happier than in the 1950s.

For Bhutan, a small Buddhist kingdom in the Himalayas, these conclusions do not come as a surprise. Already in 1972, Bhutan based its policy on Gross National Happiness (GNH). GNH takes a broader approach than economic interests, and also helps the state to consider the influence of factors like health, mental well-being and community life. Bhutan’s king observed that these factors largely influence the happiness and quality of life of the Bhutanese, and thus put them as the central objective of public policy. The video explains how it works:

Bhutan’s core philosophy thus is different, and we hardly realise how revolutionary that is. The economy and Gross Domestic Product (GDP) are central topics in the public debate in the Netherlands. We’re confronted with growth forecasts on a daily basis. Many people in the Netherlands will know that the target for the budget deficit is 3%. But will they have an idea about national happiness level? Probably not. And consider that the Social and Cultural Planning Agency (SCP) recently concluded that quality of life decreased between 2010 and 2012, for the first time in thirty years!

After Bhutan, the UK, the OECD and the European Commission, to name some, GNH could also inspire the Netherlands (and Amsterdam). Of course there is no way that our political leaders should tell you and me how to be happy. Dutch Prime Minister Mark Rutte is right in saying that the state is not a happiness machine. But the government does have the responsibility for our quality of life. But how, and what does make us happy?

gross-national-happiness2

The British new economics foundation has researched five ways to well-being. These are factors that affect the happiness and well-being of an individual: connect, be active, take notice, keep learning and give. Cities can integrate some elements in their urban planning and design. Public spaces can be designed to facilitate that people meet each other (connect) or are invited to do sports (be active). Through education and community activities, city councils can promote skills and values that help us to appreciate the moment (take notice), be curious (keep learning) and share with others (give).

The lessons of Bhutan deserve to be followed. Isn’t there a more noble cause than a happy city?