Did you feel particularly good last Friday? Maybe you enjoyed #Eclipse2015 as so many others did. Or you felt great because the world was celebrating the International Day of Happiness!
The International Day of Happiness was instituted by the United Nations in 2012, as I wrote last year. I must say that beyond a flood of tweets, I haven’t seen too many official events this year. The exception however was a very interesting data set from Eurostat that answers how happy we actually are in the EU.
I’ll come with the answers soon. But let me first give an idea on how we actually measure happiness.
How do you measure happiness?
There are practically three ways to measure happiness:
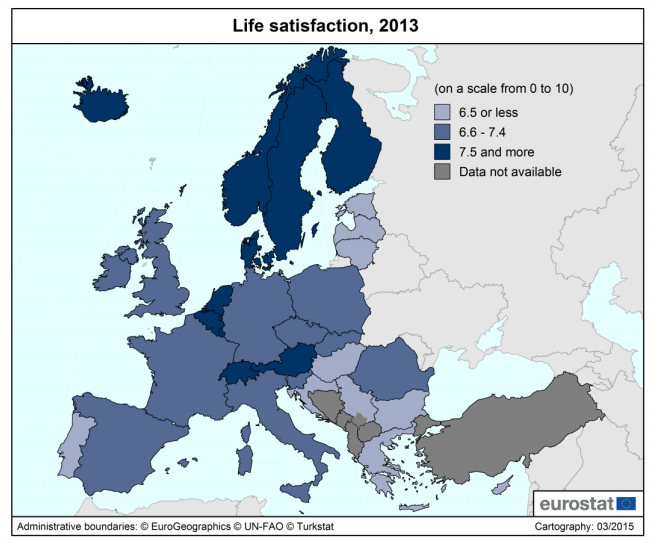
- “Overall, how satisfied are you with your life these days?” With this question, people are asked about their overall quality of life or life satisfaction. There can be a little bias there – I might answer something different today than I would tomorrow. But the experience of researchers is that these biases cancel each other when the sample is large enough.
- “How much of the time over the past four weeks have you been happy?” This question instead measures positive affect, or people’s happiness level on an emotional rather than on a more rational level. It’s based on the idea that beyond the overall life satisfaction, the presence of positive emotions and the absence of negative emotions is a good indicator of how a person really lives.
- Finally, there is ‘eudaimonia’, ‘eudaimonic happiness‘, or ‘meaning of life‘, which has a less clear-cut question. Eudaimonia broadly refers to the value and purpose of life, important life goals, and for some, spirituality. This requires a bit more reflection before it is answered.
Eurostat’s results show that the three measures are correlated at country level and at individual level, with some exceptions. A high level of positive affect is correlated with high life satisfaction and meaning of life. Still, one out of fourteen is ‘happy all of the time’ but with a low level of life satisfaction!
The good news: how happy are we?
There is a lot of good news in the figures:
- 16 out of 28 countries have an average above 7.0, and the EU average is 7.1 out of 10
- The highest level of happiness is found in Denmark, Finland and Sweden, with 8.0. The Netherlands and Austria score an 8.
- On average, young people (16-24) score highest, at 7.6. The outliers are the Austrians: 8.4!
- In Finland (8.3) and in my own home country, the Netherlands (8.0), the highest bracket is the age group 25-34. Does that mean that statistically, I will never be as happy as I am now? (The answer is: no. The study explains there can also be a ‘cohort effect’ – a group of people could retain the same happiness level, independent of their age group.
- And the happiest are… Danish seniors! The absolute highest number is found in Danes in the age of 65-74: 8.6, and 0.7 higher than the 50-64 group in Denmark (7.9). There must be something amazing about retirement in Denmark!
- There is only a marginal difference between men (7.1) and women (7.0). Also, there are slightly more women in the highest category. And controlling for differences in income, marital status, and labour market position, women are happier.
- 42.1% of Danes scores above 8, and only 5.6% of Dutch score below 6. This might actually be the most important outcome: when it’s about happiness, it is not only the average but also the distribution that should count. In these two countries, happiness seems to be distributed fairly equally.
The bad news: how unhappy are we?
But there also is a bit of bad news in the figures:
- Generally, happiness levels tend to decline with age: from 7.6 (16-24) to 6.9 (50-64), before making a little rise to 7.0 (65-74) and a further decline to 6.8 (75+)
- Bulgarians and Serbians appear to be quite miserable: they score averages of 4.8 and 4.9. In Bulgaria, every age group is below 6.
- Unemployment buys unhappiness. The difference between full-time employment and unemployment is 1.6 points (7.4 vs 5.8).
- There is also a strong relation between poverty and unhappiness. Only 7.5% of materially deprived people has a high level of life satisfaction. And deprivation of important needs (ability to pay rent, to keep the home warm, a holiday or a car) has a larger negative effect on happiness than poverty in monetary terms.
The full analysis from Eurostat is available here.