One of the Dutch traditions in May is ‘Woensdag Gehaktdag’ (a term so nice I won’t translate it). Every year, on the third Wednesday of May, the government justifies how it has implemented the budget in the last year, and the day the opposition fiercely criticises any misallocated cents.
Last week, however, Woensdag Gehaktdag saw an innovation: it saw the presentation of the first annual Monitor Broad Wellbeing. As I wrote before, this new indicator has been instigated by a parliamentary committee requesting a better toolset to evaluate how the Netherlands is doing in a broader sense than only economic indicators. Prepared by the statistics agency in cooperation with the planning agencies (for which my home country has a passion), the Monitor evaluates quality of life in three ways:
- wellbeing here and now (how are we doing in the Netherlands, today)
- wellbeing later (how do our choices today affect the future population of the Netherlands)
- wellbeing elsewhere (how do our choices affect wellbeing elsewhere)
Throw in a mix of economic, social, environmental, trade and a few extra indicators, and you get a detailed picture of what wellbeing looks like. Where data is available, the Dutch performance is also compared with other EU countries.
A high quality of life, but…
So, how is our broad wellbeing? The conclusions of the report are as follows:
- Overall, the Netherlands has a high level of quality of life. Many indicators show a positive trend over the last eight years, or a positive change with the year before. Only three out of 21 indicators were markedly negative: the number of people with obesity, satisfaction with free time, and size of nature areas.
- Nonetheless, the figures aren’t equal. Some groups report lower scores: women, some ago groups (below 25 and 55-65), those with low education levels, and migrants.
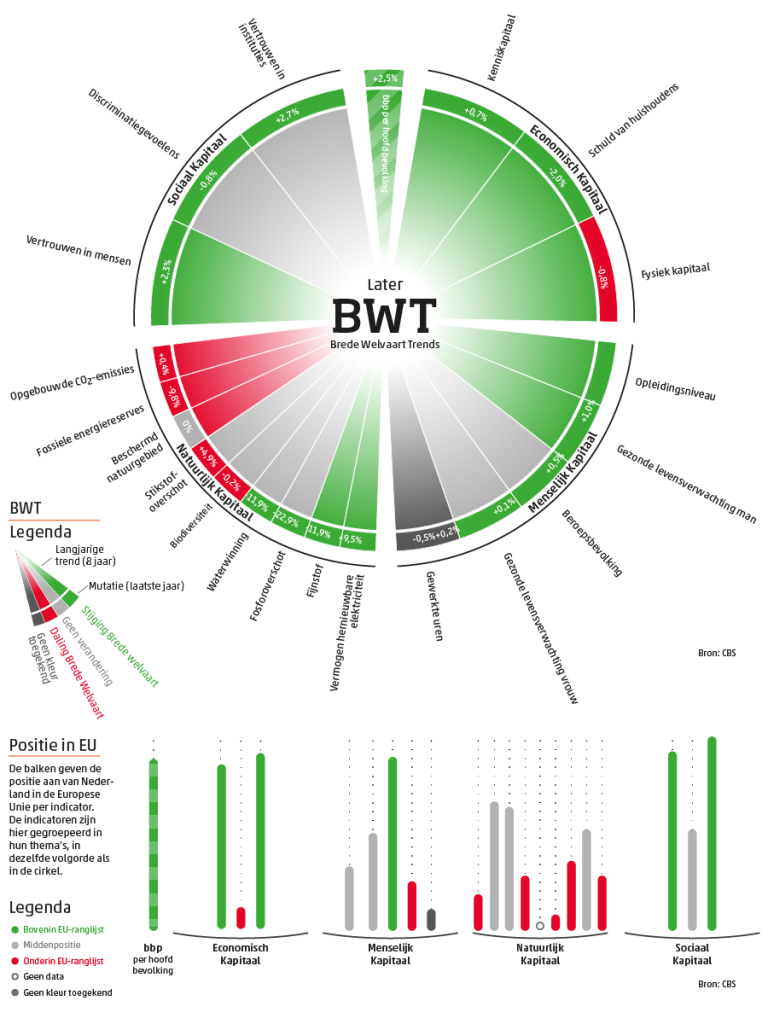
- Here’s the crux: wellbeing scores are clearly higher in the here and now then they are in the future and for the impact on elsewhere. Indicators concerning the future that post lower scores are primarily the environmental ones: CO2 and nitrogen emissions, fossil energy reserves, and biodiversity. Possibly, policy changes may see improvement here in the future, as energy is becoming cleaner and the Netherlands is due to stop all domestic gas production. However, the Netherlands large agro-food business has a massive and unsustainable footprint. You don’t directly see these negative externalities in simple indicators like GDP – a clear example of the value of the Monitor.
- Another tricky piece is that current wellbeing is also connected with a negative impact in third countries. The Netherlands has a large carbon footprint and imports resources and biomass from elsewhere, including from least developed countries (LDCs). That means that natural capital is moved from those countries.

Broad Wellbeing Monitor, ‘Later’. Source: Dutch Statistics Agency. Key: the graph evaluates the impact on wellbeing later across four categories: economic, human, natural, and social capital. Green/red represents positive/negative 8-year trends or 1-year net changes. The lower part of the graph shows how the Netherlands stand compared to fellow EU countries.
Back to politics
The report is a new annual feature, and should become a high-profile publication with an impact on policy formulation. For that, we go back from the statistics agency to politics, to the MPs and the cabinet we have mandated to make choices for us. This Wednesday will see the Parliament evaluate the government’s performance in a plenary debate, and MPs can use findings of the report to encourage the government to reshape their priorities. In this way, they can make the Netherlands a happier place, not only now, but also later and elsewhere.
