Tag Archives: Environment

Netherlands: wellbeing is more than wealth, new indicator shows

One of the Dutch traditions in May is ‘Woensdag Gehaktdag’ (a term so nice I won’t translate it). Every year, on the third Wednesday of May, the government justifies how it has implemented the budget in the last year, and the day the opposition fiercely criticises any misallocated cents.

Last week, however, Woensdag Gehaktdag saw an innovation: it saw the presentation of the first annual Monitor Broad Wellbeing. As I wrote before, this new indicator has been instigated by a parliamentary committee requesting a better toolset to evaluate how the Netherlands is doing in a broader sense than only economic indicators. Prepared by the statistics agency in cooperation with the planning agencies (for which my home country has a passion), the Monitor evaluates quality of life in three ways:

  • wellbeing here and now (how are we doing in the Netherlands, today)
  • wellbeing later (how do our choices today affect the future population of the Netherlands)
  • wellbeing elsewhere (how do our choices affect wellbeing elsewhere)

Throw in a mix of economic, social, environmental, trade and a few extra indicators, and you get a detailed picture of what wellbeing looks like. Where data is available, the Dutch performance is also compared with other EU countries.

A high quality of life, but…

So, how is our broad wellbeing? The conclusions of the report are as follows:

  • Overall, the Netherlands has a high level of quality of life. Many indicators show a positive trend over the last eight years, or a positive change with the year before. Only three out of 21 indicators were markedly negative: the number of people with obesity, satisfaction with free time, and size of nature areas.
  • Nonetheless, the figures aren’t equal. Some groups report lower scores: women, some ago groups (below 25 and 55-65), those with low education levels, and migrants.
  • Here’s the crux: wellbeing scores are clearly higher in the here and now then they are in the future and for the impact on elsewhere. Indicators concerning the future that post lower scores are primarily the environmental ones: CO2 and nitrogen emissions, fossil energy reserves, and biodiversity. Possibly, policy changes may see improvement here in the future, as energy is becoming cleaner and the Netherlands is due to stop all domestic gas production. However, the Netherlands large agro-food business has a massive and unsustainable footprint. You don’t directly see these negative externalities in simple indicators like GDP – a clear example of the value of the Monitor.
  • Another tricky piece is that current wellbeing is also connected with a negative impact in third countries. The Netherlands has a large carbon footprint and imports resources and biomass from elsewhere, including from least developed countries (LDCs). That means that natural capital is moved from those countries.
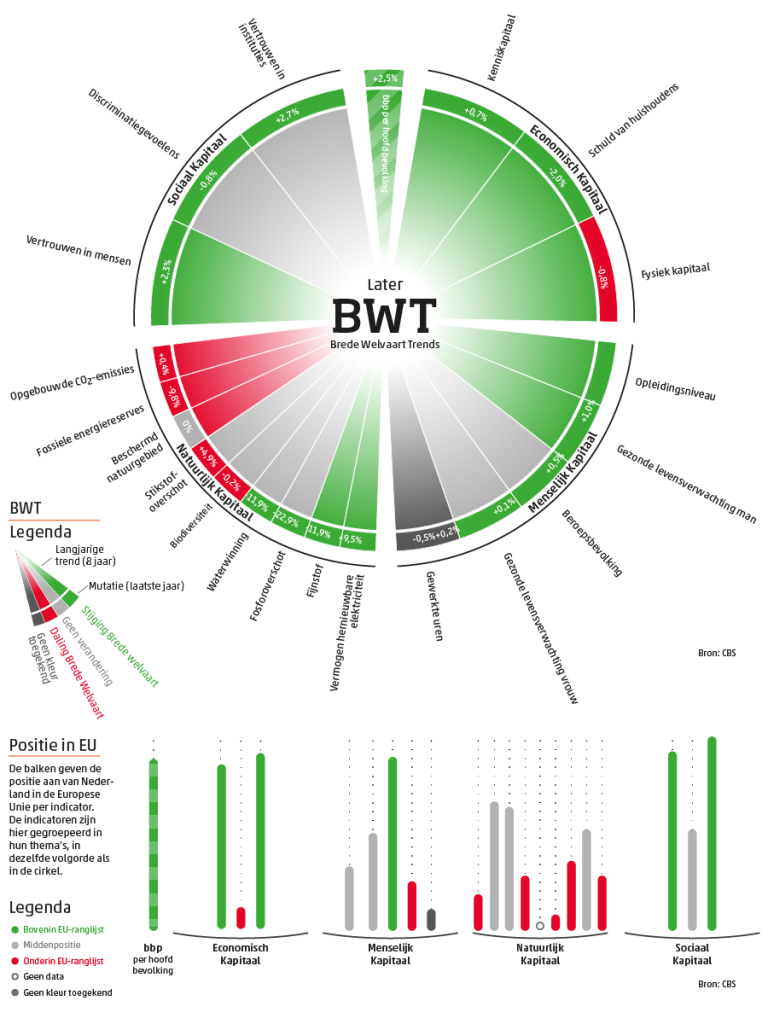
Broad Wellbeing Monitor, 'Later'. Source: Dutch Statistics Agency

Broad Wellbeing Monitor, ‘Later’. Source: Dutch Statistics Agency. Key: the graph evaluates the impact on wellbeing later across four categories: economic, human, natural, and social capital. Green/red represents positive/negative 8-year trends or 1-year net changes. The lower part of the graph shows how the Netherlands stand compared to fellow EU countries.

Back to politics

The report is a new annual feature, and should become a high-profile publication with an impact on policy formulation. For that, we go back from the statistics agency to politics, to the MPs and the cabinet we have mandated to make choices for us. This Wednesday will see the Parliament evaluate the government’s performance in a plenary debate, and MPs can use findings of the report to encourage the government to reshape their priorities. In this way, they can make the Netherlands a happier place, not only now, but also later and elsewhere.

 

Happiness: it’s not just your genes, stupid!

One of the most quoted facts about happiness goes as follows:

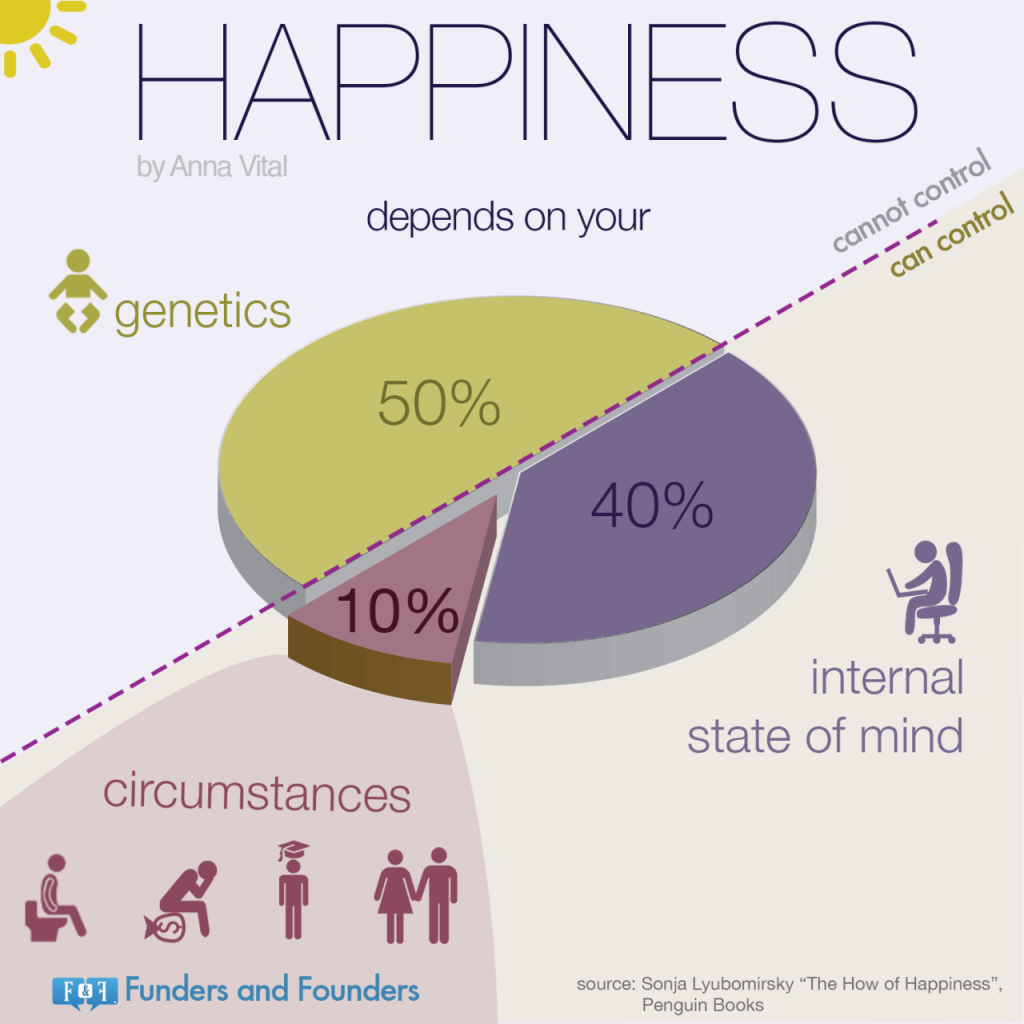
50% of happiness is determined by your genes.

10% of happiness is determined by the circumstances in which you live.

40% of happiness is determined by your actions, your attitude or optimism, and the way you handle situations.

These figures are often quoted by positive psychologists to back up claims that at least a part of our happiness is man-made. It’s a comforting message: despite the fact that there is a certain genetic disposition to be happy, there are many things in life that we can change to be happy. 40% is a large margin of manoeuvre! Imagine that we could control 40% of the weather, or the traffic on the our way to work.

According to these theories, happiness would look like this:

Source:

Source: Funders and Founders, based on material in ‘The How of Happiness’

The famous 50-10-40% formula is prominent in work done by positive psychologist Sonja Lyubomirsky. Based on a body of research in this field, she and her colleagues argued that approximately 50% of variance in happiness is determined by genes, and 10% of variance in happiness is determined by circumstances. Automatically, that would leave 40% that we can influence.


Except that, there is a lot that’s wrong with the figures and the interpretation.


Variance in happiness does not equal happiness

To start with the first important nuance: these figures explain the variance in happiness or the variation in happiness between different people. That is, genetic factors – or the presence of heritable personal traits – can explain about 50% of the difference in happiness levels between two people. It’s a small, but important detail. It means that if one person scores a 7 out of 10, and another person scores an 8, 50% of that 1-point difference could be due to genetic traits. That is not the same as saying that for a person that scores an 8, half of its level of happiness, or 4 points, are due to genetics.


Why 50% genetic, and not 40% or 60%?

Where does this theory come from? A 1996 study by Lykken and Tellegen compared well-being levels of samples of pairs of identical and non-identical twins in Minnesota, either raised together or apart. This differentiation allows to test both the impact of same or different genetics (identical vs non-identical) vs same or different environment (raised together or apart), e.g. both nature and nurture effects. Namely, identical twins share the same genes, and non-identical ones do not.

Lykken and Telleken found that the correlation of levels of well-being of identical twins in both cases are around 50%, significantly higher than for non-identical ones (2-8%). As such, they conclude that around half the variation is determined by genetics. This would leave another half determined by other factors. But it is important to note that this particular study has a limited sample. The smallest groups consists of only 36 pairs or 72 people. From a sample of twins in Minnesota, it is hard to draw so strong conclusions for human population as such.


Is it so simple?

The variance in happiness is not the full answer. In a comment of the preference of positive psychologists to favour well-rounded figures, Todd Kashdan notes a couple of other issues with genetics.

The first points is that personal traits – influenced by genetics – are not stable over life. Traits are shaped by a process called ’emergenesis’. When a characteristic is ’emergenic’, it is affected by the interaction of a couple of genes together. This might result in a behavioural predisposition to be extravert, self-controlled, or any other trait. (And similarly, there is not one ‘happiness gene’).

So far so good. But the way these genes work out is affected by many other factors. One example Kashdan mentions is that toxins or nutriments in a person’s environment can switch genes ‘on’ and ‘off’. In turn, the functioning of an individual gene can affect such an emergenic factor. If you add or take away a block from a tower, it will look different.

This reminds me of another example I learned about at a course on happiness. A certain individual may have a genetic predisposition for leadership. But if he grows up in an environment where resulting actions are suppressed, the talent will not come to fruition. As such, genes could be seen as ‘enabling’ factors, that only result in an outcome (such as happiness) when underlying conditions are met.


Genes interact with the environment

Another important issue notes is the interaction of genes and environment. In the same article, Kashdan writes that

Much of what influences our personality has to do with the presence of (positive and negative) life events and our response to choice points. Do I approach or avoid my co-worker who regularly demeans me? Do I wake up early and workout or sleep in? Do I ask out the girl I’ve had a crush on for months or do I keep my feelings to myself? No single decision matters but the patterns do. The decisions we make, the people we surround ourselves with, and the behaviors we engage in, are the building blocks for the quality of our lives. Small changes accumulate over time leading to large changes in who we become.

Our personality is the result of a complex process, in which genes and environment interact. Can we really put a hard number on that?


Happiness is not a formula

My answer is no. There is no comfortable formula for happiness. What we can say, is that our genes play an important role in determining happiness. But so do other factors, including our circumstances, environment, and our actions. Happiness is not a hard science. It is a way too complex phenomenon to quantify. But maybe that’s one of the reasons why it is so fascinating.

Rather than like a pie chart with three elements, happiness may rather look like a complex system:

The Internet as a Complex System. Source: opto.org

The Internet as a Complex System. Source: opto.org