Category Archives: Happy Countries

Does GNH policy work? The answer is in common values

What is Gross National Happiness (GNH) actually good for? And how do policymakers in Bhutan really use their unique development tool?

In previous posts, I’ve dived into the methodology of GNH and crunched some of numbers behind the 43,4% of happy Bhutanese. GNH was once developed to provide an alternative to the logic of mere economic development. Obviously, in the end GNH is as good or as bad as it will be used. As an observer, it seems that Bhutan stands close to GNH, for instance in environmental policy and community life.

But to really know how it works, I asked Kent Schroeder at Humber College, Canada to help me find out if GNH leads to different government decisions. He should know: he did his PhD on the implementation of GNH in Bhutan, and interviewed around 150 policymakers on all levels.

Who’s doing GNH?

Schroeder told me that several Bhutanese institutions are working on GNH: the GNH Commission, the think tank Centre for Bhutan Studies (CBS), and the government.

  • The GNH Commission is a powerful body that is consulted by the government on the GNH effects of new policy initiatives. It’s reviewing new public policy initiatives before adoption. And the GNH Commission even publishes draft policies online, allowing the public to comment.
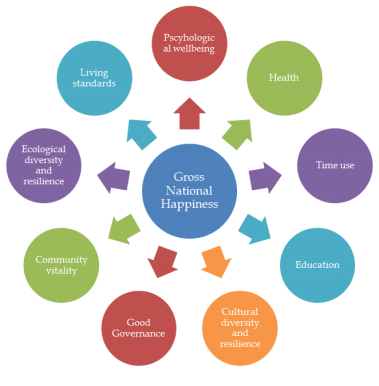
  • In addition, there is a policy screening tool, through which the Commission reviews the impact of a prospective policy on the nine domains of GNH. The tool scores all elements of the policy on a scale from 1 to 4: 1 means a negative impact, while 4 means a positive impact. In the EU bubble, we would call this a happiness impact assessment!
  • The most prominent example of the use of the policy screening tool leading to different results was the question on whether Bhutan should join the World Trade Organisation (WTO). After reviewing the consequences on GNH, the GNH Commission advise against becoming party to global free trade rules.
  • The CBS is also a highly recognised think tank, and is the driving forced behind the GNH index I’ve written so much about.
  • And then of course there are all policymakers at national, district and local level who formally all are required to follow the concept of GNH in their policies. Schroeder tells me that the GNH principle is taken into account for Bhutan’s five-year plans. In the next cycle, GNH will be devoluted, meaning that local administrations should take more responsibility. Officials can use local checklists similar to the national screening.

Does it work?

So, the means are there to effectively integrate GNH in public policy. But does it work in practice? To answer that question, Schroeder in his PhD thesis research reviewed four policy areas, namely media, tourism, farm roads, and human-wildlife conflict.

His conclusions about the effectiveness of GNH policies are as follows:

  • The influence of GNH on policy actions is unpredictable. Policies are shaped in a complex policy process, and the level of influence of different actors across policy areas and districts. As such, the impact of GNH policy tools on policy processes is limited.
  • Bhutanese citizens, and even policy makers, often do not understand what GNH really means. There is no common concept and these different interpretations also affect the policy process. Simply put, GNH is often not understood!
  • As a result, the outcome varies per policy area. Media and tourism policies largely reflect the aims of GNH. For farm roads, on the short term policy conforms with the GNH concept, but on the long term, Schroeder doubts its effect on sustainability. Finally, for the policies on the interaction on human and wildlife – a real issue in Bhutan where farmers often have to stay awake in the night to chase animals from their farmland – the result is mixed. This is also a consequence of the ambiguity of GNH.

Common values ensure GNH

Reading this, one would doubt the relevance of GNH as a concept. But there is no reason to be so dire. Even though the process is not as structured as the concept would suggest, the underlying values used by policy makers in determining their course of action typically conform with the values of GNH. As such, policy outcomes often reflect what GNH would imply – even if they’re not recognised as being connected with GNH!

GNH: 2015 survey finds 43,4% of Bhutanese are happy

How happy is Bhutan?

According to the 2015 Gross National Happiness (GNH) survey, 43,4% of the Bhutanese are considered happy.

This figure is the outcome of the survey by the Centre for Bhutan Studies and GNH research for 2015. During the survey, researchers interviewed 7.153 respondents, asking them 148 questions each to distill their GNH. The number came about via a complex methodology, which is about a lot more than just asking people about their life satisfaction.

How are people happy?

  • 8.4% of Bhutanese are ‘deeply happy’ (or scoring over 77% of the weighted indicators), against 8.3% in the 2010 survey.
  • 35.0% are ‘extensively happy’ (score of 66-76%), going up from 32.6% in 2010
  • 47.9% are ‘narrowly happy’ (score of 50-65%). In 2010, this group of narrowly happy people was larger, at 48.7%
  • Only 8.8% are considered ‘unhappy’ (below 50%) in 2015, while in 2010, 10.4% were unhappy.

This shows a small increase of GNH between 2010-2015. But as Bhutanese Prime Minister Tshering Tobgay said when presenting the results during the GNH conference, we cannot really interpret what this increase means:

“Is this [increase in GNH] fast or slow? We don’t know.”

Some of the other outcomes:

Urban up, rural more slowly

  • People are happier in urban areas and the improvement is stronger in urban areas than in rural areas (the survey is designed to be representative for both the urban and rural area in every of Bhutan’s 20 districts).
  • This is quite remarkable given the quick modernisation and urbanisation. As CBS researcher Thsoki Zangmo told me, Bhutanese living in cities score better on living standard and education, but worse on community and cultural indicators. This might suggest that the departure of people to the city affects community life in rural place of origin more than in the city, the destination.
  • But these findings are provisional – the CBS will publish more detailed analysis next year. And, Tshoki says, we need more data points to really understand these factors. Therefore, the survey will be repeated every three of four years.

More happiness for everybody

  • Roughly, improvements seem to be equalising: improvements are stronger under disadvantaged groups (women, elders, uneducated, and farmers). However, the survey design is not representative so these findings are indicative

Smaller downs, bigger ups 

  • Confusingly, no less than 14 individual domains and indicators show decreases. However, these are more than offset by (larger) increases in 11 indicators. Roughly, ‘harder’ domain as living standards and health improve, while ‘softer’ ones like community vitality and psychological well-being decrease.

Dreaded government offers good services 

  • A final remarkable finding is that the young Bhutanese democracy – established 2008 – quickly has created a complex relation with politics. As Prime Minister Tobgay didn’t shy away from mentioning, the perception of government is down by 48 percentage points. Both Tobgay and the researchers contributed that to the euphoria about the new democracy resulting in a high score in 2010, whilst electoral bickering in 2013 may have reduced the number in the 2015 survey.
  • At the same time, however, the satisfaction with government services has increased by 20 percentage points. In short, Bhutanese are very satisfied with public services delivered by a dreaded government!
View in front of my hotel in Paro Valley

View in front of my hotel in Paro Valley

How is Gross National Happiness measured in Bhutan?

I’ve already written about the concept of Gross National Happiness (GNH) a lot. But attending the international GNH conference in Paro, Bhutan, I have improved my understanding of what GNH really means. In a couple of blog posts, I want to outline the methodology, the 2015 survey findings, and the actual use of GNH as a policy tool.

Let’s start with the methodological part here. It’s a bit more technical exercise, but at least it helps to understand what we are really talking about when referring to GNH and where the numbers come from. If you’re interested in the results for 2015, be patient for a couple of days.

The nine domains and 33 indicators of GNH

GNH has been devised by Bhutan as an alternative indicator for GDP as a tool to measure progress or development. The level of GNH for an individual and for Bhutan as a country are determined through measures in nine domains. The Centre for Bhutan Studies and GNH research’s nine domains (see picture below) are all based on well-being research determining their link to well-being and happiness.

The nine domains of GNH. Source: Provisional findings of 2015 GNH Survey

The nine domains of GNH. Source: Provisional findings of 2015 GNH Survey, p. 11

All domains are weighted equally, or at 1/9. For most domains, there are four underlying variables. Each of the 33 variables is tested through one or more questions within the 1,5 hour personal interview. For instance:

  • the domain education is measured via asking respondents about the variables literacy, schooling, knowledge about certain areas, and values.
  • Living standards are measured through the indicators household income, assets, and housing.
  • The psychological well-being measure consists of life satisfaction, positive emotions, negative emotions, and spirituality.

The weights of the various variables in a domain are unequal. The different weights are based on scientific reliability and validity. In general, subjective (or personal) indicators have been given lower weights than objective (or factual) indicators.

How do all these answers result in a GNH score for an individual and for the country as a whole?

It’s not just a simple average. As statisticians say,

When your head is in the oven and your feet in the freezer, your average temperature is normal

In happiness, averages don’t count: e.g. a excessively low level of positive emotions cannot be countered by an extremely high level of household income.

Sufficiency targets

For this reason, within each indicator, a ‘sufficiency target’ is set to reduce the impact of outlier answers. A person is considered ‘happy’ under this indicator when the ‘sufficiency’ level is achieved. For example, sufficiency targets are set as follows:

  • ‘Six years education’ for the indicator ‘schooling’ in the domain education
  • A monthly income level of 23.127 Ngultrum (about €325) for the indicator ‘household income’ in the domain living standards.
  • For the indicator ‘life satisfaction’ in the domain psychological well-being, a score of 19 out of 25 points on five questions related to satisfaction with health, occupation, standard of living, family, and work-life balance.

Thresholds to be ‘extensively’, ‘deeply’, or ‘narrowly’ happy

Based on all answers for the 33 indicators, it can be determined on how many indicators a person is sufficient, and a judgement is given how happy a person is. These thresholds are as follows:

  • Sufficiency in 77%-100% of the weighted 33 indicators: deeply happy
  • Sufficiency in 66%-76%: extensively happy
  • Sufficiency in 50%-65%: narrowly happy
  • Sufficiency in 0%-49%: unhappy or ‘not-yet-happy’

Of course these cut-off limits are arbitrary. If we want to express the GNH or happiness in a number, I would consider the first two categories as happy, and the lower two as unhappy. But in one Bhutanese newspaper, I’ve read an article grouping the first three under ‘happy’, hence resulting in a headline stating that more than 90% of Bhutanese are happy.

How valid are these figures?

Within happiness research, there is a continuous discussion on the reliability, validity, and overall usefulness of indicators to measure happiness, well-being, life satisfaction, and quality of life. An important part of these is the distinction between objective and subjective indicators.

For instance, a subjective indicator like ‘life satisfaction’ asks people to rate their overall level of life satisfaction. Of course people throughout cultures and with different personalities would assess their levels differently. A certain level of happiness could be expressed as an 8 by one person and as a 7 of another person. In addition, the bias might differ from country to country. For instance, one could theorise that people in Bhutan aware of the concept of GNH could be under pressure to answer with a high number, increasing the average.

To some extent, the use of objective criteria – like the number of years of schooling – avoids these problems. But again, there are problems with objective criteria. Most importantly, they assume that the researcher can reliably determine what qualify of life is for a respondent. What if a person has had only five years of schooling, but is still satisfied with this? Ultimately, there is no way around this dilemma, and it is one of the reasons for criticism of alternative indicators.

It’s the trend, not the headline figure, that counts

Happiness, though, is not an exact science. Parties deal differently with this reality. The Centre for Bhutan Studies (and also, the OECD), has considered that the best way is to use objective indicators where available, and subjective indicators where necessary. As researcher Tshoki Zangmo explained me, the CBS feels that a balance is needed as they’re both important to determine GNH.

When you dig deep into these, every choice has methodological and practical limitations. Every measure for happiness or well-being is imperfect, arbitrary and subject to criticism. Of course the same can be said for the GDP measures that happiness indicators aim to provide an alternative for!

Also, the trends within the nine different domains and constituent indicators are probably more relevant for the policy than the ultimate outcome in numbers. For instance, a finding that psychological well-being is decreasing, that might be a lot more useful input to public policy than the conclusion that overall GNH is 0.756.

The present article is based on the methodology of the GNH index 2015 and some separate questions to CBS researcher Tshoki Zangmo.

IMG_3223

The conference tent, with the stage in the front, seen from my seat among a group of local high school students.

“It’s not easy to do the right thing” – lessons on GNH from Bhutan

These days I’m spending in Paro, Bhutan, attending the international conference on Gross National Happiness (GNH). I’ll share more detail when I’m back. But this is what I learned so far:

1. GNH is a gift of Bhutan to the world

Panellists are flanked by the 4th and the 5th king of Bhutan at the podium.

Panellists are flanked by the 4th and the 5th king of Bhutan at the podium.

Imagine your country is quietly sitting in a remote area of the world, the Himalayas. Then, by launching (and redeveloping) GNH you’re thrust on the world scene. People from all over the world flock to your country to learn and be inspired by the wisdom that “Gross National Happiness is more important than Gross Domestic Product”. This phrase was first expressed by King Jigme Singye Wangchuck in 1979. Now, people in countries as diverse as Bolivia, United States, Japan, Ecuador, Bangladesh, UK, Brazil, Germany and South Africa all come to benefit from the Bhutanese generosity in sharing the idea.

2. We are in the third phase of development of GNH

The concept of GNH dates back to the 1970s and the name to 1979. But for a couple of decades it remained a philosophical concept, valuable to the Bhutanese but seen as too abstract for outsiders. That changed in the late 1990s and the 2000s, when with international support and interest GNH was further engineered to become an index with 9 domains. It also gave rise to two surveys, in 2010 and 2015, mapping the level of GNH in Bhutan. (In the 2015 survey with 7153 individuals, 43.4% were ‘extensively’ or ‘deeply’ happy).

Now we are in the third phase. The main question now is not what GNH is about, but how can it be implemented in policy and hands-on projects. There are a set of policy tools and institutions in Bhutan available, but practical implementation is patchy now. But watch this space – GNH is in movement.

3. GNH is not an excuse not to do the right thing

The most powerful presentation by far was by Dasho Neten Zangmo. She served in high functions in the Bhutanese administration, most recently as anti-corruption chief. When her term ended last June, she didn’t stay in the capital Thimphu. Instead, she went back to a small village in Samdrup Junkhar in Eastern Bhutan, to promote zero waste, environmental preservation, and organic farming (the rise of education in Bhutan has made young people better equipped. But it also results in unemployment and a lack of new farmers unique in Bhutan’s history). In Bhutan as in Western countries, everybody say they care about the environment. But doing the right thing is not easy – it’s hard to avoid plastic bottles.

The fundamental underlying point is another one: if GNH is only about providing an alternative indicator, it is not enough. We need material change in the way we look at and act in development and progress in both developed and developing countries. Or in academic terms, a paradigm shift.

GNH is not only an inspiration. It should ultimately change our actions. GNH should help us to DO the right thing.

Comments? Write jasper (@) forastateofhappiness.com.

Bhutanese performance during one of the breaks

Bhutanese performance during one of the breaks

Realising the Bhutanese dream

A couple of years ago I heard about an idea that eventually changed my life. That idea was Gross National Happiness (GNH).

It sounds dramatic, but it is true. I must have heard about it before, but I was first truly captivated by the idea of GNH through a TED talk by Chip Conley with the title ‘Measuring What Makes Life Worthwhile’. At the time, I wrote a blog post for TEDxAmsterdam making the case to measure happiness and change the state.

No, the rest was not history. But everything that followed brought me to the creation of this blog, my coming of age as a happiness researcher and speaker, and ultimately to my trip to Bhutan to explore GNH.

Explore Gross National Happiness

Because indeed, four years after this first blog post, I finally have the chance to travel to Bhutan. I’ll be in the fortunate position to attend a conference on Gross National Happiness “From GNH Philosophy to Practice and Policy” at the Centre for Bhutan Studies. The CBS is a research institute on Bhutan and GNH, based in the capital Thimphu. While GNH as an idea dates back to the 1970s, it has been developed more thoroughly in the 2000s and 2010s. The 2012 GNH survey found that 8% of Bhutanese is ‘deeply happy’ and 32% ‘extensively’ happy. 48% of the 700,000-odd Bhutanese citizens scores ‘narrowly happy’, which means achieving a sufficient level in 50% of the 33 indicators. Only 10% of Bhutanese is unhappy.

GNH is not only something that is being researched and benchmarked. Importantly, the policy requires that new government proposal need to be assessed for their impact on GNH. For instance, Bhutan has decided not to join the World Trade Organisation (WTO) after a finding that it would not contribute to GNH.

A country full of paradoxes like any other

Making a dream come true is risky.

It can be dangerous to make a trip I’ve so long looked forward to. Due to GNH, Bhutan has long been a darling of Western travelers looking for philosophy, spirituality, and ultimately, happiness. Some Western observers have idealised or ‘Shangrilised’ Bhutan as a country.

Others, on the other extreme, have criticised the country as hypocrite for its low level of development, the use of GNH as an excuse for a failure to meaningfully increase the quality of life, or for ethnic violence in the 1990s.

Only when I am there I’ll know whether I am falling in either of these traps.

I’ve had several years the time to do my research and hopefully I have a balanced image of the place. Recently in my preparations of the trip, I read the book ‘A splendid isolation‘ by journalist Madeline Drexler. She aims to offer a balanced approach, highlighting that Bhutan like any other country on the world is full of paradoxes:

  • Tobacco advertising and smoking are forbidden – but in 2011, there was an outcry when a monk was sentenced for three years for smuggling in chewing tobacco for a value of $2.50.
  • There is a target of 100% organic crops – but many food products are imported from India.
  • Economic development is a policy objective – but self-owned business are seen as ungenerous to the collective.
  • Anti-litter laws are strict – but citizens ignore them.

Well, all I can do is promise to share my experience upon my return.

And for the mean time, I’ll leave you with a documentary that made a great impression on me. In a few words, it shows how Bhutan as a country is struggling with the arrival of modern times. Or more precisely, with the arrival of TVs – replacing yaks – in the countryside.

The Unhappy States of America: three decades of decline in happiness

In the United States, the self-proclaimed greatest country on earth, people are in for a surprise when you ask them to guess how high the US ranks in the World Happiness Report 2015. The US takes the fifteenth spot with a 7.119, falling just below – God-forbid … Mexico! The top-three countries Switzerland, Iceland and Denmark trail the US by about 0.4 points.

unhappy America

Source: The Economist

Like any country in the world, the US is full of contradictions. On the one hand, it is the second largest economy, the leader of the Western world (except France), and home to the revolutionary digital industries of Silicon Valley. On the other hand, news about the US often talks about growing inequality, racial tensions, hardly affordable healthcare and education, a rising use of anti-depressants, and an inexplicable rigidity in gun policies. By some Europeans, it seen as a developed country trapped inside a developing one.

What went wrong?

So was the US a better place three decades ago?

Some people think it was. Proponents of alternative economic indicators to Gross Domestic Product (GDP) have argued that since the start of neo-liberal Reaganomics, the focus has been too much on economic growth and too little on quality of life as a whole. For instance, the US Genuine Progress Indicator aims to measure exactly that: genuine progress, based on performance on economic, environmental and social issues. Comparing US scores from the 1950s until recent, it sees a peak in the 1970s. Since, the benefits of economic growth have been off-set by the cost of income inequality, leisure time, and environmental degradation.

Other studies, however, draw other conclusions. It’s often written  that happiness levels are remarkably stable in Western developed countries in the last 50 years. The World Values Survey does not show major movements since the 1980s. The World Happiness Report scores the US in 2015 (data from 2012-2014) only marginally lower, about -0.2, than in 2005-2007.

Three decades of growing inequality

Inequality is very often cited as one of the reasons related to the decreasing life satisfaction in the US. Stanford University has pooled a set of charts documenting the rise of inequality in the last decades:

  • In 1979, CEOs earned 35 times as much as the average production worker. In 2009, 185 times (after a peak of almost 300 in 2000!).
  • In real terms, only college graduates have seen their wages grow since 1979. This is not the case for people who attended but didn’t graduate college, or only have a high school degree. This ‘education wage premium’, however, comes at the cost of student loans up to $50,000 or $100,000, begging the question what is college worth?
  • From 1983 to 2007, the share of wealth of the upper 10% has increased from 68.2 to 73.1%, while the bottom 50% went from 6.1 to 4.2%.

The World Happiness Report also points out that increasing female labour market participation could be a factor in changes in happiness: since the mid-1970s, the share of female labour has increased. At the same time, the ‘happiness advantage’ of women over men has reversed, likely because many women tend to have lesser quality jobs in the US market.

What can be done about it?

At least according to the stereotypes, Americans more than any other nations are able to set an objective and go for it. That’s what the American dream is about. Professor Jeffrey Sachs, one of the contributors to the World Happiness Report, points out a couple of the answers. Increasing equality and social trust is where the answer starts. That also means a mental shift: a state providing healthcare or financing education shouldn’t be seen as giving ‘hand-outs’ or ‘redistribution’, but as a state that ensures that everybody can get ahead. In short, it’s about throwing some of solutions from Switzerland, Iceland or Denmark into the United States. If the US wants to be the best and greatest in happiness, drastically reducing social immobility and inequality is the first step to go.

Hope in the Greek crisis of happiness

As so many in Brussels I’ve been following all the news about the Greek crisis on a daily basis in the last weeks. I have followed these events professionally. I reviewed the politically progress in the talks, the economic impact on the eurozone, and contemplated the scenarios for further developments.

But with this professional distance, it is easy to forget how saddening these developments are .

Staying away of the question who is at fault, the tragedy is that politicians don’t come closer to each other. Countless meetings at ministerial level and several Euro Area Summits are ineffective.

The referendum about the latest EU reform proposals divided families between those who wanted to show their opposition to austerity and those who felt that no deal might be worse than a bad deal.

And Greek society suffers under extreme stress, as pharmacies run out of some medicines and banks don’t release more than sixty euros per day.

Pensioners – who often have the only income for a family of unemployed people – have to cue hours to receive 120 euros of their pension.

The best way to sum the crisis up may have been the picture of the crying Greek pensioner that made way of media in the last day. The photo is by Sakis Mitrolidis (AFP). The man on the photo broke down after being refused his ‘allowance’ by four banks in a row in Thessaloniki.

Photo by AFP/Sakis Mitrolidis

Photo by AFP/Sakis Mitrolidis


Effects on happiness

It should not be a surprise that a country in crisis is not a happy country. In psychology, there is a concept of ‘loss aversion’. Humans are surprisingly adapted to live in hardship. That is, if they are used to it. The impact of winning an additional hundred of euros in income is marginal compared to the negative effects of losing one hundred euros. In dollar terms, Greeks are not so miserable with a GDP per capita of  $21,687 in 2014. That’s about 1,5 times Polish GDP and twice the level of Turkey or Mexico. But whilst the latte three have grown their income in the last five years, Greek GDP is about 20% lower than five years ago.

This crisis also has a marked effects on happiness levels. The 2015 World Happiness Report does not only have figures for 2012-2014, but also compares them with the period 2005-2007. Greece is the biggest loser in happiness worldwide, scoring almost 1.5 points lower now than before the crisis. On a ten points scale, Greece’s happiness now stands at 4.857, ranking 102 out of 158 countries polled.

When Greek Prime Minister Tsipras and EU leaders that do want to show solidarity, they speak about taking measures to address the humanitarian crisis. Apart from that, there is also a psychological crisis or a ‘crisis of happiness’. Well-being of Greeks is further under pressure.

What to do?

It is clear that a political solution is needed to take away some of the uncertainty and distress. I am optimistic that yesterday’s Summit, the latest in the row, is allowing some progress. There is no financial programme yet, but the message is that it can be done in the next five days.

For the crisis of happiness, what we need is positive stories coming out of Greece. Shows of solidarity and support help.

A great example in the last week is the effort of Thom Feeney. He decided that if EU leaders couldn’t agree on a bailout, he would crowdfund €1.6 bn for Greece to repay the IMF himself. Maybe not so surprisingly, the effort failed (and the money was reimbursed), but with over €1.9 mln collected in a week time, his campaign did send a more positive signal about EU populations’ support for Greece. It’s now followed by a second campaign, aiming to raise €1 mln in humanitarian aid.

Screenshot Indiegogo

Screenshot Indiegogo


Also in the case of the Greek pensioner, the severest crisis resulted in a positive response. An Australian-Greek businessman – whose father grew up in the same village – heard about the story and decided to support the man with twelve months of pensions money.

These are only two stories. They reach a small number of people and can by no means solve all of the crisis. But they offer glimmers of hope that the days of gloom may be over.

Can we replicate Denmark’s success story?

Last week I gave an anecdotal explanation to Denmark’s happiness. To complete the story, today I would like to ask what the Danes think themselves about their high levels of happiness, and whether it’s a success can be replicated elsewhere.

What do Danes think themselves?

If I believe what Meik and Marie Louise from the Happiness Research Institute say, I get the impression that Danes find the interest in their high happiness levels amusing and comical. Danes tend to point at what is not good in Denmark: mental health issues and depression, a complex relation with immigrants, a reputation of not being too outgoing. Part of the disbelief, says Meik, may have to do with the fact that ‘lykke’, the Danish word for ‘happy’, is a term for quite an extreme term. Jante’s Law in mind, it’s probably to say that things are not bad than that they are amazing.

Can we replicate Denmark’s success?

Whether it is through well-crafted policies or a lucky coincidence of getting many things right, Denmark as a state manages to achieve one of the highest levels of happiness. Is there anything in Denmark that can be replicated elsewhere? My feeling is there are three factors that can be easier taken at heart elsewhere:

  • Urban design. Certain factors in the design of a city are related with the happiness of its citizens. A city like Copenhagen is easy to navigate, has green spaces close-by in various neighbourhoods, and can be travelled by bike. This allows people to get around easily and to be active, and the example can be followed elsewhere. The term ‘Copenhagenize‘ has already been used to drive the use of bicycles into other cultures.
  • Work participation. I believe work-life balance (also cited in the Happy Danes report) is an important factor in Danes’ levels of happiness. Acceptance of flexitime and working from home, subsidised creches and generous maternity leave, a full year to be divided by the two parents) are helpful. This allows people to pursue a career and benefit from the overall positive impetus for happiness levels of work, whilst maintaining a meaningful relation with growing children.
  • Strive to take away barriers. Kristian mentioned he does not have to worry about healthcare or education. If such services are accessible for all, this can prevent worries resulting in unhappiness. In other countries, such as the US, the belief that it’s people’s own responsibility to reach success in life is a barrier in the pursuit of happiness. Without wanting to sound like a communist – if US politicians want to increase quality of life, raising taxes to decrease the cost of health and education may provide part of the answer.
Copenhagen is full of bikes. Photo by Kasper Thyge/Visit Copenhagen

The size and design of Copenhagen help people to get around by bikes, spending little time on work-home commutes and being active on the go. Such a policy can be replicated elsewhere. Photo by Kasper Thyge/Visit Copenhagen

An anecdotal explanation to Danish happiness

Why is Denmark so happy? And most importantly: which of Denmark’s lessons can we replicate in other countries?

These were my main questions during a short study visit to Copenhagen that I undertook last week. Denmark routinely tops the rankings of happiest countries. In the 2015 World Happiness Report, it lost two places (going from 3 to 1), but it still the happiest country of the EU. And it is home to a dedicated think-tank on the issue: the Happiness Research Institute!

Another observation: Danish flags are everywhere

Another observation: Danish flags are everywhere. One day walking around in Copenahgen, we counted about 80 of them!

Let’s first share a couple of my findings and observations from three days in Copenhagen. And then, next week, I’ll provide my answer to the question whether Denmark’s secrets are unique to the land of the Dannebrog (the omnipresent flag) and Smorrebrod (Danish sandwiches served with fish, meat or potatoes), or whether they can be implemented elsewhere.

My findings

These findings are based on impressions and conversations with people over a couple of days. If you allow me, I’ll be a bit anecdotal today; I’ve discussed a more evidence-based list of factors identified in the Institute’s report on the Happy Danes before.

Opportunities to live the good life…

Our host Kristian identified two possible theories behind Denmark’s high happiness levels: firstly, Denmark offers plenty of opportunities to live a good life. At the cost of high taxes, the state takes many reasons to worry (and unhappiness) away: healthcare is free, and students cannot only attend university without any tuition fee, but also receive an allowance to do so.

At the same time, there does not seem to be a dominant path set out for you. It seems individuals have the possibility to choose their lifestyle quite freely. In Danish, there is no formal version of ‘you’, even the Prime Minister is a ‘you’. Compare this  to the difference between informal and formal in many languages, such as du and Sie in German, or titles like ‘Sir’ and ‘Dame’ in the UK social class system. Even the Danish royals seem to be down-to-earth: our tour guide’s repertoire includes an anecdote about petting the royal dog and entering a conversation with Crown Prince Frederik and princess Mary on the street.

… but low expectations?

The second theory Kristian cites is that low expectations about life can be a factor. As the expression has it, low expectations are key to a happy life. According to Danish-Dutch philosopher Stine Jensen’s, the so-called Law of Jante can explain the unpretentious mentality of the Danes. Half-ironic, half-serious the law of Jante drawn up by writer  Aksel Sandemose formulates ten rules Danes (and other Scandinavians) are required to live by. These include:

  • You’re not to think you are anything special.
  • You’re not to convince yourself that you are better than we are.
  • You’re not to think you can teach us anything.

Happiness is within easy reach

This attitude and the small scale of the Danish society, at some 5 million people, could possibly explain why Danes live well together in their community. In a sunny May weekend in Copenhagen I observed a vibrant social life. With many Danes, I spent my Saturday night on the Tivoli Lunapark, and on Sunday in amongst hipsters in the Papiroen Street food Mekka and amongst hippies in Christiania. At the same time, the sun didn’t only colour my face but also bias my view. On a grey and cold March days, when winter is in its seventh month, there’s little to be ecstatic about.

That’s it for today. Next week, I’ll get to two other questions: what do Danes think themselves about their high levels of happiness, and can their lessons be replicated their elsewhere?

IMG_2615

Sitting on a sunny terrace at the waterfront, happiness is within easy reach

The World Happiness Report 2015: a wealth of data to make the world a happier place

The World Happiness Report 2015 is out and struck some headlines last week. Number one this year is Switzerland, and Togo comes last. But beyond praising winners and shaming losers, there is a lot more of interested figures to find. A quick selection of some of them.

The good news: how happy are we?

  • Let’s start with the good news. Of 130 countries where it was possible to compare data from 2012-2014 with 2005-2007, 53 saw significant improvements in happiness levels (41 decreased and 36 had no meaningful change). This suggests the world is a slightly happier place then it used to be.
  • The biggest improvements were made in Nicaragua, Zimbabwe, Ecuador, Moldova and Sierra Leone, who each added around one full point in their score.
  • It’s the well-expected developing countries that fill the top-1o: Iceland, Denmark, Norway, Canada, Finland, Netherlands, Sweden, New Zealand, and Australia, all a solid 7.3 or higher
  • … and what’s the score of the number one, Switzerland? With three decimals to be Swiss and precise, we get to 7.587.

Other good news (but not in stats)!

  • The most important sections maybe are not those listing the countries, but providing case studies of cities and regions who have changed their policies to make use of all the knowledge about happiness, from Dubai to Jalisco (Mexico), and from Santa Monica to Bristol.
  • At the same time, progress is also made in the neuroscience of happiness. A dedicated chapter 5 summarizes some of the findings. For instance, evidence about the link between positive emotions and happiness appears to be stronger and stronger.
  • There is more and more understanding about the various distribution patterns of happiness within age groups and genders. Overall, women are slightly happier than men. Over age groups, the patterns differ per region: in Central and Eastern Europe, Central Asia and South Asia, happiness goes down as age progresses. But in East Asia, but also in Western Europe, the best comes last: happiness levels go up as people enter their 70s.

The bad news: how unhappy are we?

  • There is still a lot, a lot of misery on our planet. More than fifty countries have happiness levels below 5.
  • And the worst-performing are truly miserable. Countries like Syria and Afghanistan, but also Rwanda, Benin and Burundi fall under 3.6 The lowest level is found in Togo at 2.839.
  • Two countries on different sides of the Mediterranean – Egypt and Greece – have lost more than one point. And some others (Jordan, Rwanda, Saudi Arabia, and Italy) lost around three quarters of a point.
  • For instance, the case of Italy (-.764, now at 5.948) is worrying. Usually, a high happiness level means a high level of resilience in phase of challenge. This fabric might be unraveled as result of the crisis Italy is going through.
  • To end with a positive note: he best ‘losers’, as far as one could be a loser with a score of 7.527, are the Danes. Denmark typically ranks one in most of the happiness report. I have been told that usually, it is no news when a happiness ranking is published, but this time it was: apparently, Danes are not used anymore to come second (or third, as now).

And now?

The 2015 World Happiness Report comes out with a large ambition: influencing the next development goals. As the UN prepares to adopt Sustainable Development Goals (SDGs) to succeed the Millennium Development Goals (MDGs) this year, the hope is that happiness outcomes are targeted within the SDGs. A worthwhile ambition: ultimately increasing human happiness and its fair distribution should be the goal of public policy.

One concern: the SDG process appears to be very complex, with over 150 different – and often, vague – ideas currently on the list of goals that could be adopted later this year. In such a process, they risk to lose their meaning. But either way, the wealth of statistics provides a lot of inspiration and background data to policy makers to make the world a happier place.

Geography of happiness