Category Archives: Science

Does size matter: higher tax, happier countries?

One of the oldest questions in political philosophy is of course: does size matter? Or to phrase it more precisely for the aims of this blog, does the size of the state influence the level of happiness of its population?

There are two ways of looking at the questions. Firstly, does the size of population matter for the quality of life? And secondly, how large a role should the government play in society?

Small is beautiful

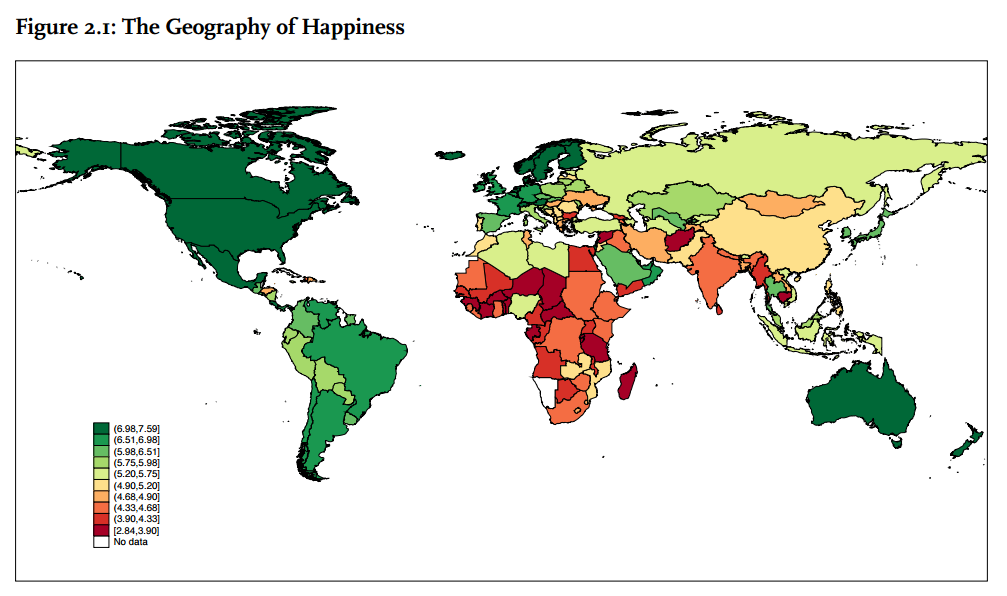
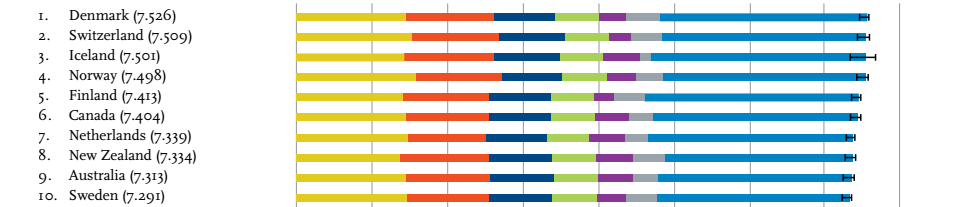
At least at the anecdotal level, the first question is relatively to answer. It appears that smaller countries, typically, have happier populations than larger ones. From a theoretical angle, that makes sense. If a country is smaller, it is more likely to have a more homogenous population, and people are more likely to feel close to each other. For instance, this would result in a better community life, one of the factors associated with happiness. A glance at the 2016 World Happiness Report shows that most of the top-ten countries are relatively small, with Denmark, Switzerland and Iceland in the top-three, and only Canada, Netherlands and Australia (numbers six, seven and nine) having a population above 10 million.

Schermafbeelding 2016-05-22 om 18.37.08

Father state makes you… happy?

There is a second way of looking at the question, though. Does the share that the government takes in the economy and society affect happiness levels? Is it the invasive Big Government or rather the freedom of the laissez faire night-watcher state that makes people best off?

A book by Benjamin Radcliff, The Political Economy of Human Happiness, suggests there are three ways of measuring state size when assessing the correlation: welfare spending; overall government spending; and taxation.

From a theoretic perspective, one could presume a link between government spending and happiness. For instance, welfare policies could be expected to provide the safety net to lower income and/or unemployed people, and therefore reduce inequality. Similarly, a large amount of government spending – for instance by providing free or subsidised education or healthcare – could result in higher happiness levels.

Indeed, the evidence assessed by Radcliff suggests this kind of link. His data shows that for one of the metrics, linked to welfare spending, countries scoring high on this indicator, happiness levels are above one point higher than low-scoring countries. He suggests that this contribution to happiness is double that of being married (being married is positively correlated with happiness), and three times the negative drag of unemployment. To give an example: if your baseline happiness is 7, living in a state with high spending would statistically increase your happiness to 8. Being unemployed would drag it down to 6,7. That’s the magnitude of the influence of the state size according to Radcliff’s evidence!

More tax, more happiness

Government spending doesn’t come for free. While taxation of citizens and companies isn’t the only source of income, it typically is the most significant one. Could it really be the case that being taxed more resulted in citizens being happier?

Again, the data suggest there is a correlation. Radcliff even states that “higher levels of taxation suggest higher levels of satisfaction with life”.

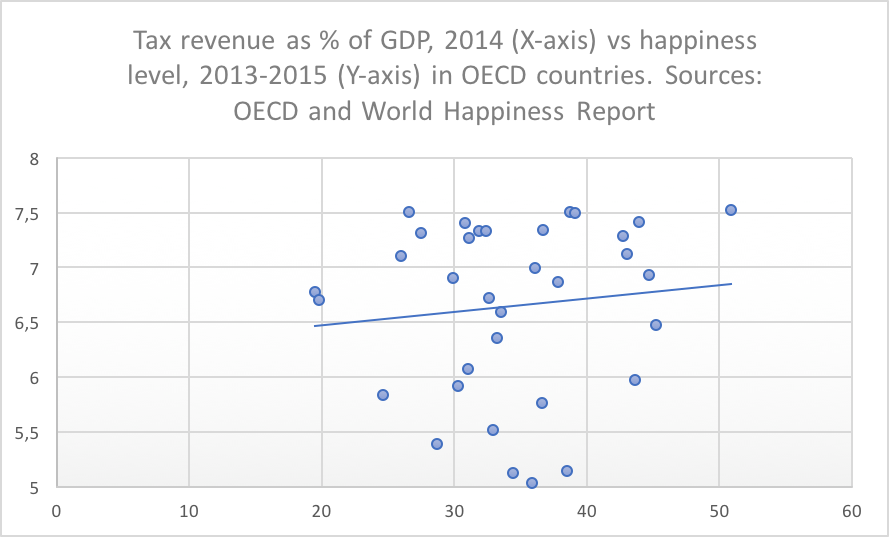
The graph here compares taxation levels (tax revenue as % of GDP) with happiness levels (life satisfaction), based on data from the OECD and the World Happiness Report quoted above. It shows an increasing trendline, associating a level of taxation of 20% in this group of OECD countries with a happiness level of around 6.5. All others thing equal, a level of 50% is correlated with a happiness level of around 6.8: some one thirds of a point higher across the trendline.

But not all others things are equal: the distribution is broad and the effects are very diverse. Denmark is on the top right with a happiness level of 7.526 and the very highest tax level of 50,9. On the far left, we find Switzerland with a marginally lower happiness level of 7.509 and only half the tax rate at 26.6%. On the lowest part of the graph, with happiness levels just above 5 points, we find Portugal, Greece and Hungary, with taxation levels around 34-38%.

tax vs happiness


Correlation, goes the warning to every first-year student, is not causation. The 34 countries of the OECD provide some interesting figures, but there are many other factors than taxation that determine happiness. Idiosyncratic factors and practical things like a state’s efficiency – what kind of society does is create with the 20 or 50% tax money it collects? – certainly also play a role. I’ll look at some of what the states does next week: the Nanny State.

The Good Life: 75 years of research in five simple words

One of the eternal quests of men is to discover the good life. The key to happiness, one would suppose, cannot be simple. What would the conclusions be of a 75-year study of the Good Life be? They must at the minmum fill a small library.

In what is now one of my favourite TED talks, Robert Waldinger summarises the takeaways in twelve minutes I need to eat my breakfast.

75 years of study

Waldinger is the director of the so-called Grant Study. In the longitudinal study, started 75 years ago, Harvard students starting university in the years 1939-1944 have been studied throughout their life. Every two years, research staff came to see them, asking them about health and illness, happiness and misery, career and love. Based on thousands of data points, the researchers got an in-depth understanding of how the health of these 268 men developed over life. The study included people running for senator (and one US President – guess and check at the end of the post if you were right!), doctors and lawyers, but also people who fell down hard from the top. And to ensure the findings wouldn’t be biased on different realities of the Harvard elite, the study early in its history was complemented by a survey of a sample of 456 inner city Boston boys.

Social relations for happiness and health

How did Waldinger summarise all these years of data in his twelve minutes? Simple: he pointed out how social relations are the key to our happiness and our health:

  • Social connections are good for us – and loneliness kills. Social relations to friends, family and community are correlated with longer lives. And loneliness is toxic: it’s associated with earlier decline in health.
  • Quality is king. Living in conflict is bad for health: high-conflict marriages without affection may even be worse than getting divorced. That doesn’t mean that everything goes smoothly: the typical bickering old-age couple isn’t too problematic, as long as both partners know they can rely on each other in case of need.
  • Good relations protect our brain. If you want to predict the health of someone’s brain at age 80, data of their relationship satisfaction age 50 provide a good indication.

Is it really that simple?

If you’re a sceptic, I know what you’ll say reading this. First: how can we make judgements based on relatively small samples, of only 268 and 456 studies. Second: is there proof that this correlation means causation. If we study 10,000 instead of just over 700 people, are the effects the same? Thirdly: is the key to happiness this simple and obvious? Can it be reduced to, just, being a good person to your wife or husband?

The honest answer is: I don’t know. I haven’t conducted the research myself. I haven’t analysed the 10,000s of data points to come to these conclusions. The way I see it is that these conclusions, maybe more than anything, are good reminders to focus on the big picture from time to time as we frantically go from place to place and task to task, busy living our lives.

In two articles portraying the study in the Atlantic in 2009 and 2013, Waldinger’s predecessor as study lead George Vaillant presents a couple of other lessons. And again, these are quite obvious, or at least, they don’t come as big surprises:

  •  Alcoholism is destructive, and the number one cause of divorce.
  • From a certain point, a higher IQ doesn’t affect incomes anymore
  • A good relationship with your mother matters your entire life
  • And: aging liberals have better sex lives (ok, maybe that one was actually less obvious!)

Tools to unravel the mystery of happiness

In our attempts to unravel the mystery of happiness, we use all kind of different tools, from spiritual retreats to decade-long surveys. Ultimately, even though happiness means different things for different people, probably the conclusion of most of these quite similar. In the words of Vaillant, when summarising his decades as leader of the study:

“Happiness is love. Full stop”


And who was the later US President who participated in the study? John F. Kennedy.

Less is more: a minimalist life

I’ve spent some time the last month in packing, storing, and reordering, as I moved recently. It made me realise how much stuff I own: books I’ve read a long time ago, clothes I don’t wear, postcards and pictures reminding me of ancient times in my own life, scientific articles to prepare my thesis while in university, all kind of random small objects… so much stuff!

When I was in this reflective mood, I met a guy who has a lot more minimalist approach to life than I did. I’ll call him Alex, because that is his name. Alex lived in various countries throughout his life, and ended up in Brussels around a year ago. He rents a room here, and all his own possessions fit in two suitcases. (Funnily, he admitted he owns seven pairs of underwear, so he needs to do laundry at leat once per week, but is thinking of buying more of them).

Alex doesn’t necessarily define himself a minimalist, but there any people who do. For some, it means picking a certain lifestyle which is less about stuff and more about experiences. For others, there clearly is a sport in it to count and reduce the number of items they own, to 288 items only, to 100, or even 50 or below. Some go by with less than seven pieces of underwear. To be honest, most of cheat a little: they may count three pieces of underwear as one item!

Does less stuff equal more happiness?

Have the minimalists found a pathway to happiness in a time when storage centers are booming business? The science on stuff and happiness is not that clear. According to this post, minimalism is a tool that can help people reassess their priorities. For instance, when the focus shifts away from owning stuff and towards spending money on experiences or social relations, that is something that contributes to happiness.

From research on the relation between consumption, money, and happiness, we know for a long time time that there are ‘hedonic adaptation’ and a ‘hedonic treadmill’ effects. Once we acquire something new, we quickly get used to it, and need to buy other things again to retain this feeling. Hence, material goods do not create lasting happiness, and we up storing boxes and boxes of stuff outside our house.

To the contrary, spending money on special experiences works, says professor Michael Norton. You might not remember anything anymore about the experience of buying a piece of clothing five years ago. But I bet you remember a special outing you did, like going skydiving or a hike with friends.

Storage centers, a booming business.

Storage centers, a booming business.

It’s decluttering and ordering, not minimising, that matters

One of the great benefits of minimalism, wrote one of the bloggers I read, is the following: you never have to look search for anything, and cleaning your apartment takes only a couple of minutes. But all good virtues come in moderation. A couple of more extreme people like Alex aside, probably most of us are better off with just a bit less and better organised stuff, not a minimal amount of stuff.

Looking at blogs and book titles, there is an enormous hype around ‘decluttering’. This term simply means clearing ‘clutter’ out of our houses and our lives, by throwing (or giving) away clothes, books, and household items you don’t need. When all your stuff is in your life and your house for a reason – be it because of a practical use, or sentimental value – you’re in a situation where less is more.

Am I tempted to throw away all my books and become a minimalist? Absolutely not. I have selected and re-selected my collection, and I cherish those books I’ve kept. I like to believe that everything I own is there for a reason.

These chaps may disagree. But to me, it’s not the number of items in your life that counts, but the life in your items.


How is Gross National Happiness measured in Bhutan?

I’ve already written about the concept of Gross National Happiness (GNH) a lot. But attending the international GNH conference in Paro, Bhutan, I have improved my understanding of what GNH really means. In a couple of blog posts, I want to outline the methodology, the 2015 survey findings, and the actual use of GNH as a policy tool.

Let’s start with the methodological part here. It’s a bit more technical exercise, but at least it helps to understand what we are really talking about when referring to GNH and where the numbers come from. If you’re interested in the results for 2015, be patient for a couple of days.

The nine domains and 33 indicators of GNH

GNH has been devised by Bhutan as an alternative indicator for GDP as a tool to measure progress or development. The level of GNH for an individual and for Bhutan as a country are determined through measures in nine domains. The Centre for Bhutan Studies and GNH research’s nine domains (see picture below) are all based on well-being research determining their link to well-being and happiness.

The nine domains of GNH. Source: Provisional findings of 2015 GNH Survey

The nine domains of GNH. Source: Provisional findings of 2015 GNH Survey, p. 11

All domains are weighted equally, or at 1/9. For most domains, there are four underlying variables. Each of the 33 variables is tested through one or more questions within the 1,5 hour personal interview. For instance:

  • the domain education is measured via asking respondents about the variables literacy, schooling, knowledge about certain areas, and values.
  • Living standards are measured through the indicators household income, assets, and housing.
  • The psychological well-being measure consists of life satisfaction, positive emotions, negative emotions, and spirituality.

The weights of the various variables in a domain are unequal. The different weights are based on scientific reliability and validity. In general, subjective (or personal) indicators have been given lower weights than objective (or factual) indicators.

How do all these answers result in a GNH score for an individual and for the country as a whole?

It’s not just a simple average. As statisticians say,

When your head is in the oven and your feet in the freezer, your average temperature is normal

In happiness, averages don’t count: e.g. a excessively low level of positive emotions cannot be countered by an extremely high level of household income.

Sufficiency targets

For this reason, within each indicator, a ‘sufficiency target’ is set to reduce the impact of outlier answers. A person is considered ‘happy’ under this indicator when the ‘sufficiency’ level is achieved. For example, sufficiency targets are set as follows:

  • ‘Six years education’ for the indicator ‘schooling’ in the domain education
  • A monthly income level of 23.127 Ngultrum (about €325) for the indicator ‘household income’ in the domain living standards.
  • For the indicator ‘life satisfaction’ in the domain psychological well-being, a score of 19 out of 25 points on five questions related to satisfaction with health, occupation, standard of living, family, and work-life balance.

Thresholds to be ‘extensively’, ‘deeply’, or ‘narrowly’ happy

Based on all answers for the 33 indicators, it can be determined on how many indicators a person is sufficient, and a judgement is given how happy a person is. These thresholds are as follows:

  • Sufficiency in 77%-100% of the weighted 33 indicators: deeply happy
  • Sufficiency in 66%-76%: extensively happy
  • Sufficiency in 50%-65%: narrowly happy
  • Sufficiency in 0%-49%: unhappy or ‘not-yet-happy’

Of course these cut-off limits are arbitrary. If we want to express the GNH or happiness in a number, I would consider the first two categories as happy, and the lower two as unhappy. But in one Bhutanese newspaper, I’ve read an article grouping the first three under ‘happy’, hence resulting in a headline stating that more than 90% of Bhutanese are happy.

How valid are these figures?

Within happiness research, there is a continuous discussion on the reliability, validity, and overall usefulness of indicators to measure happiness, well-being, life satisfaction, and quality of life. An important part of these is the distinction between objective and subjective indicators.

For instance, a subjective indicator like ‘life satisfaction’ asks people to rate their overall level of life satisfaction. Of course people throughout cultures and with different personalities would assess their levels differently. A certain level of happiness could be expressed as an 8 by one person and as a 7 of another person. In addition, the bias might differ from country to country. For instance, one could theorise that people in Bhutan aware of the concept of GNH could be under pressure to answer with a high number, increasing the average.

To some extent, the use of objective criteria – like the number of years of schooling – avoids these problems. But again, there are problems with objective criteria. Most importantly, they assume that the researcher can reliably determine what qualify of life is for a respondent. What if a person has had only five years of schooling, but is still satisfied with this? Ultimately, there is no way around this dilemma, and it is one of the reasons for criticism of alternative indicators.

It’s the trend, not the headline figure, that counts

Happiness, though, is not an exact science. Parties deal differently with this reality. The Centre for Bhutan Studies (and also, the OECD), has considered that the best way is to use objective indicators where available, and subjective indicators where necessary. As researcher Tshoki Zangmo explained me, the CBS feels that a balance is needed as they’re both important to determine GNH.

When you dig deep into these, every choice has methodological and practical limitations. Every measure for happiness or well-being is imperfect, arbitrary and subject to criticism. Of course the same can be said for the GDP measures that happiness indicators aim to provide an alternative for!

Also, the trends within the nine different domains and constituent indicators are probably more relevant for the policy than the ultimate outcome in numbers. For instance, a finding that psychological well-being is decreasing, that might be a lot more useful input to public policy than the conclusion that overall GNH is 0.756.

The present article is based on the methodology of the GNH index 2015 and some separate questions to CBS researcher Tshoki Zangmo.

IMG_3223

The conference tent, with the stage in the front, seen from my seat among a group of local high school students.

The Unhappy States of America: three decades of decline in happiness

In the United States, the self-proclaimed greatest country on earth, people are in for a surprise when you ask them to guess how high the US ranks in the World Happiness Report 2015. The US takes the fifteenth spot with a 7.119, falling just below – God-forbid … Mexico! The top-three countries Switzerland, Iceland and Denmark trail the US by about 0.4 points.

unhappy America

Source: The Economist

Like any country in the world, the US is full of contradictions. On the one hand, it is the second largest economy, the leader of the Western world (except France), and home to the revolutionary digital industries of Silicon Valley. On the other hand, news about the US often talks about growing inequality, racial tensions, hardly affordable healthcare and education, a rising use of anti-depressants, and an inexplicable rigidity in gun policies. By some Europeans, it seen as a developed country trapped inside a developing one.

What went wrong?

So was the US a better place three decades ago?

Some people think it was. Proponents of alternative economic indicators to Gross Domestic Product (GDP) have argued that since the start of neo-liberal Reaganomics, the focus has been too much on economic growth and too little on quality of life as a whole. For instance, the US Genuine Progress Indicator aims to measure exactly that: genuine progress, based on performance on economic, environmental and social issues. Comparing US scores from the 1950s until recent, it sees a peak in the 1970s. Since, the benefits of economic growth have been off-set by the cost of income inequality, leisure time, and environmental degradation.

Other studies, however, draw other conclusions. It’s often written  that happiness levels are remarkably stable in Western developed countries in the last 50 years. The World Values Survey does not show major movements since the 1980s. The World Happiness Report scores the US in 2015 (data from 2012-2014) only marginally lower, about -0.2, than in 2005-2007.

Three decades of growing inequality

Inequality is very often cited as one of the reasons related to the decreasing life satisfaction in the US. Stanford University has pooled a set of charts documenting the rise of inequality in the last decades:

  • In 1979, CEOs earned 35 times as much as the average production worker. In 2009, 185 times (after a peak of almost 300 in 2000!).
  • In real terms, only college graduates have seen their wages grow since 1979. This is not the case for people who attended but didn’t graduate college, or only have a high school degree. This ‘education wage premium’, however, comes at the cost of student loans up to $50,000 or $100,000, begging the question what is college worth?
  • From 1983 to 2007, the share of wealth of the upper 10% has increased from 68.2 to 73.1%, while the bottom 50% went from 6.1 to 4.2%.

The World Happiness Report also points out that increasing female labour market participation could be a factor in changes in happiness: since the mid-1970s, the share of female labour has increased. At the same time, the ‘happiness advantage’ of women over men has reversed, likely because many women tend to have lesser quality jobs in the US market.

What can be done about it?

At least according to the stereotypes, Americans more than any other nations are able to set an objective and go for it. That’s what the American dream is about. Professor Jeffrey Sachs, one of the contributors to the World Happiness Report, points out a couple of the answers. Increasing equality and social trust is where the answer starts. That also means a mental shift: a state providing healthcare or financing education shouldn’t be seen as giving ‘hand-outs’ or ‘redistribution’, but as a state that ensures that everybody can get ahead. In short, it’s about throwing some of solutions from Switzerland, Iceland or Denmark into the United States. If the US wants to be the best and greatest in happiness, drastically reducing social immobility and inequality is the first step to go.

Seligman, a founding father of positive psychology

George Washington, James Madison, Thomas Jefferson, Benjamin Franklin and Alexander Hamilton. For most people in the United States and elsewhere, these names probably ring a bell. Together with may others, these man count under the Founding Fathers of the United States.

Could anybody be considered as a the founding father of happiness studies, or ‘positive psychology’ as the academic discipline is usually called? On such a list, academics like Christopher Peterson, Ed Diener, Mihaly Csikszentmihalyi, Daniel Kahneman, and Ruut Veenhoven deserve to be mentioned. And although every movement grows as result of interaction and cross-fertilisation, Martin Seligman probably is the primus inter pares. As president of the American Psychological Association, Seligman decided to focus his term on positive psychology.

What are Seligman’s achievements?

Getting up from a 2 to a 5…

As Seligman very well explains in his TED talk, psychology from its emergence in the early 20th century has been preoccupied with curing ill people. Psychologists have aimed to get people who score a 2 or a 3 up to a 5 or a 6. As a result of the focus on misery, psychologist have developed a complex system of classification and treatment of disorders. A large amount of psychological disorders that make people miserable can now be treated: a great advance for science.

… or from a 5 to an 8?

At the same time, there has been less attention for getting people that already score a 5 or a 6  up to a 7, 8 or 9 – or to understand what a 9 in happiness actually means. Come in Selligman and other positive psychologists. Since the 1980s, many scholars have measured and modeled happiness, and researched the link with happiness. Happiness is correlated with a lot of positive things, from longer healthy life years to better marriages and social relationships, and better performance in the education systems.

What an 8 means: flourishing

One of the most important contributions from Seligman is modeling what happiness is about, and what makes people ‘flourish’ in their personal life. Flourish is also the title of his 2011 book in which explains his ideas. This model is summarised with the acronym ‘PERMA’, standing for:

  • Positive Relations
  • Engagement
  • positive Relations
  • Meaning; and
  • Accomplishment

… as five elements contributing to a pleasant, good, or meaningful life.

The PERMA model. Source: Authentic Happiness pages, Penn University

The PERMA model. Source: Authentic Happiness website, Penn University


The next step: positive interventions

Then, the next step of the field of positive psychology is to find out what it is that gets people up to the higher numbers. This is where we get to ‘positive interventions’, or steps that can contribute to our happiness. Dr. Seligman and his team have developed and tested some twelve positive interventions.

In his talk, Seligman describes a few of them:

  • Three good things. Every evening, write down ‘three good things’ that happen during that day. This exercise trains gratitude
  • Have a beautiful day. The concept here is to ‘design’ a day to spend in a very pleasant way.
  • Gratitude visit. Think of someone important in your life who you couldn’t thank enough for their support to you. Write down why you appreciate what they’ve done for you. And then go and visit them to tell them.

Which of these would you like to try?


Happiness: it’s not just your genes, stupid!

One of the most quoted facts about happiness goes as follows:

50% of happiness is determined by your genes.

10% of happiness is determined by the circumstances in which you live.

40% of happiness is determined by your actions, your attitude or optimism, and the way you handle situations.

These figures are often quoted by positive psychologists to back up claims that at least a part of our happiness is man-made. It’s a comforting message: despite the fact that there is a certain genetic disposition to be happy, there are many things in life that we can change to be happy. 40% is a large margin of manoeuvre! Imagine that we could control 40% of the weather, or the traffic on the our way to work.

According to these theories, happiness would look like this:

Source:

Source: Funders and Founders, based on material in ‘The How of Happiness’

The famous 50-10-40% formula is prominent in work done by positive psychologist Sonja Lyubomirsky. Based on a body of research in this field, she and her colleagues argued that approximately 50% of variance in happiness is determined by genes, and 10% of variance in happiness is determined by circumstances. Automatically, that would leave 40% that we can influence.


Except that, there is a lot that’s wrong with the figures and the interpretation.


Variance in happiness does not equal happiness

To start with the first important nuance: these figures explain the variance in happiness or the variation in happiness between different people. That is, genetic factors – or the presence of heritable personal traits – can explain about 50% of the difference in happiness levels between two people. It’s a small, but important detail. It means that if one person scores a 7 out of 10, and another person scores an 8, 50% of that 1-point difference could be due to genetic traits. That is not the same as saying that for a person that scores an 8, half of its level of happiness, or 4 points, are due to genetics.


Why 50% genetic, and not 40% or 60%?

Where does this theory come from? A 1996 study by Lykken and Tellegen compared well-being levels of samples of pairs of identical and non-identical twins in Minnesota, either raised together or apart. This differentiation allows to test both the impact of same or different genetics (identical vs non-identical) vs same or different environment (raised together or apart), e.g. both nature and nurture effects. Namely, identical twins share the same genes, and non-identical ones do not.

Lykken and Telleken found that the correlation of levels of well-being of identical twins in both cases are around 50%, significantly higher than for non-identical ones (2-8%). As such, they conclude that around half the variation is determined by genetics. This would leave another half determined by other factors. But it is important to note that this particular study has a limited sample. The smallest groups consists of only 36 pairs or 72 people. From a sample of twins in Minnesota, it is hard to draw so strong conclusions for human population as such.


Is it so simple?

The variance in happiness is not the full answer. In a comment of the preference of positive psychologists to favour well-rounded figures, Todd Kashdan notes a couple of other issues with genetics.

The first points is that personal traits – influenced by genetics – are not stable over life. Traits are shaped by a process called ’emergenesis’. When a characteristic is ’emergenic’, it is affected by the interaction of a couple of genes together. This might result in a behavioural predisposition to be extravert, self-controlled, or any other trait. (And similarly, there is not one ‘happiness gene’).

So far so good. But the way these genes work out is affected by many other factors. One example Kashdan mentions is that toxins or nutriments in a person’s environment can switch genes ‘on’ and ‘off’. In turn, the functioning of an individual gene can affect such an emergenic factor. If you add or take away a block from a tower, it will look different.

This reminds me of another example I learned about at a course on happiness. A certain individual may have a genetic predisposition for leadership. But if he grows up in an environment where resulting actions are suppressed, the talent will not come to fruition. As such, genes could be seen as ‘enabling’ factors, that only result in an outcome (such as happiness) when underlying conditions are met.


Genes interact with the environment

Another important issue notes is the interaction of genes and environment. In the same article, Kashdan writes that

Much of what influences our personality has to do with the presence of (positive and negative) life events and our response to choice points. Do I approach or avoid my co-worker who regularly demeans me? Do I wake up early and workout or sleep in? Do I ask out the girl I’ve had a crush on for months or do I keep my feelings to myself? No single decision matters but the patterns do. The decisions we make, the people we surround ourselves with, and the behaviors we engage in, are the building blocks for the quality of our lives. Small changes accumulate over time leading to large changes in who we become.

Our personality is the result of a complex process, in which genes and environment interact. Can we really put a hard number on that?


Happiness is not a formula

My answer is no. There is no comfortable formula for happiness. What we can say, is that our genes play an important role in determining happiness. But so do other factors, including our circumstances, environment, and our actions. Happiness is not a hard science. It is a way too complex phenomenon to quantify. But maybe that’s one of the reasons why it is so fascinating.

Rather than like a pie chart with three elements, happiness may rather look like a complex system:

The Internet as a Complex System. Source: opto.org

The Internet as a Complex System. Source: opto.org

Spinach is not the key to happiness. And neither is Coca Cola.

Sex sells. But happiness might sell even better.

Marketers know that very well. They claim that purchasing their products – as opposed to their competitor’s – make a consumer happy. I already commented a bit on this a couple of months ago, in two posts about the psychological effects of food, and about marketing food with happiness claims.

Since, I came across this sign:

happiness

Beyond this a funny and simple sign in front of a bar with a cheeky claim about happiness, I also saw a perfected version of the message “Buy us = happiness” from Coca-Cola.

The giant sugared drinks producer is becoming the strongest commercial happiness provider. After taking happiness as a theme via ‘Share Happiness’ and ‘Open Happiness’ campaigns, it now has launched regional campaigns under the name ‘Choose Happiness’. In Belgium, one of the posters alludes to Brussels’ symbol Manneken Pis. It looks like this:

CocaCola


The science of food and happiness states that marketers very occasionally do have a point when they claim that their products can increase people’s happiness or positive emotions. ‘Comfort foods” fatty acids affect neural signals in the brain, and can result in a weaker response to sad images. And the production of serotonin, the neurotransmitter most linked to positive emotions and happiness, can be aided by products like spinach, turkey and bananas. Before you stock up on spinach, consider that this implies a limited positive link, and by no means a direct and automatic effect. Spinach is not the key to happiness.

And, sorry to disappoint you, neither are gin-tonic and Coca-Cola. The sugar rush of a Coke can give a momentary positive stimulus to your mood. But the same is true for a Pepsi, and neither equals happiness. Slogans like ‘Choose Happiness’ misleadingly suggest an automatic effect. Of course we rationally know that all the expression of fun, social status, and the good life are artificial tricks to seduce us.

But by claiming happiness, marketers enter a very personal life domain. If, as Coca Cola seems to argue, people have full control of their own happiness (‘success is a choice’),it implies that the easiest way to be successful is by consuming their product. It also transmits the message that failure is a choice, and that is our own fault if we are unhappy. That’s not something that I as a consumer want to hear from a company.

In a way, I prefer the cheeky slogan of a bar, saying that a gin tonic brings us closer to happiness. It’s a lot more playful way of attracting attention.

If I wanted a drink of happiness, I’d go for a gin-tonic.

Happiness in the past, present and future

Robert Biswas-Diener is one of the most original thinkers on happiness I know. His work provides a smart counterweight to the ‘happiologist’ part of positive psychology. A happiness consultant himself, he observes that within the ‘happiness biz‘, there are a lot of people who appear to see happiness at work as the one and only goal.

Interestingly, Biswas-Diener does not agree. He points that when people are happy, they are likely to have a ‘good enough’ philosophy. Gratitude and acceptance form one aspect of happiness. But being grateful with what you have can also hinder self-improvement. Instead, Biswas-Diener believes in the ‘upside of your dark side’: negative emotions like guilt, grief and anger can drive our actions and help us grow.

This is a very helpful contribution to the discipline of positive psychology, which sometimes appears to believe that acceptance and gratitude can take away real problems. Being positive can help in dealing with problems, but cannot take them away. A positive mindset should inspire real actions to face difficulties.

Happiness is in the past..

Only last week I came across Biswas-Diener’s TED talk, with the tile ‘Your Happiest Days are Behind You’. In his talk, Biswas-Diener answers one of the fundamental questions:

How can I be happier?

The common tendency of individuals is to see happiness as something in the future. One of the main reasons why people are unhappy is that they project happiness on goals they haven’t achieved yet. And often, these goals are conflicting:

‘If only I met a nice girl’.

‘If only I had a child’.

‘If only I had that dream job at the Commission.’

‘If only I could work less, and have more holidays’

As Biswas-Diener formulates it: the future is an unreliable sources of happiness. How can we escape from our own expectations about the future? There are various ways out. One of them is by manufactured or ‘synthetic happiness‘, as psychologist Dan Gilbert says. What my answer is, I’ll say below. But first, let’s look at Biswas-Diener’s answer.

The past is the source of happiness…

In his very, very worthwhile talk, Biswas-Diener says that the past, not the future, is the source of happiness. The happiest days are behind you. And with a personal story that I absolutely recommend you to watch, he tells us why he so much believes in the past as a source of happiness. The gist is as follows: by remembering happy moments of the past, you will be able to recreate moments of happiness, and you will experience them again.

Have you watched the story? Can you imagine the race between Robert and the little girl in the slum of Calcutta? Great!

Robert states that memories like this race are the ones that are the answer to the question ‘how can I be happier’. And I agree that remembering happy experience is a very significant part of the answer. But I wonder how reliable the effect remains when one remembers the same memory more often. I would expect there is a somewhat limited life span, as the ‘happiness impact’ of these emotional moments may wear off when you tell or relive the story more regularly.

Compare it to a band playing their hit singles: initially it’s great to see the crowd cheer when they hear your top hit. But if concert after concert, day after day, all the audience wants to hear is the same songs, it doesn’t feel the same anymore. A diverse set of top hits (and happy moments!) thus is important.

… or is it the present?

Therefore, I’d argue that neither the future, nor the past are truly reliable sources of happiness. Instead, I would focus on… the present. Ultimately, our life is lived in the now, not in the future nor in the post. Our aim should be to spent our ‘nows’ – the moment that is easiest to control – in a way that makes us happy. We can go out on a day when the weather is nice. We can do sports, meet friends, or work on goals that are important for us. And by doing so, and appreciating the great moments along the way, we both work on a happy future and create a supply of happy memories that we can enjoy again.

The World Happiness Report 2015: a wealth of data to make the world a happier place

The World Happiness Report 2015 is out and struck some headlines last week. Number one this year is Switzerland, and Togo comes last. But beyond praising winners and shaming losers, there is a lot more of interested figures to find. A quick selection of some of them.

The good news: how happy are we?

  • Let’s start with the good news. Of 130 countries where it was possible to compare data from 2012-2014 with 2005-2007, 53 saw significant improvements in happiness levels (41 decreased and 36 had no meaningful change). This suggests the world is a slightly happier place then it used to be.
  • The biggest improvements were made in Nicaragua, Zimbabwe, Ecuador, Moldova and Sierra Leone, who each added around one full point in their score.
  • It’s the well-expected developing countries that fill the top-1o: Iceland, Denmark, Norway, Canada, Finland, Netherlands, Sweden, New Zealand, and Australia, all a solid 7.3 or higher
  • … and what’s the score of the number one, Switzerland? With three decimals to be Swiss and precise, we get to 7.587.

Other good news (but not in stats)!

  • The most important sections maybe are not those listing the countries, but providing case studies of cities and regions who have changed their policies to make use of all the knowledge about happiness, from Dubai to Jalisco (Mexico), and from Santa Monica to Bristol.
  • At the same time, progress is also made in the neuroscience of happiness. A dedicated chapter 5 summarizes some of the findings. For instance, evidence about the link between positive emotions and happiness appears to be stronger and stronger.
  • There is more and more understanding about the various distribution patterns of happiness within age groups and genders. Overall, women are slightly happier than men. Over age groups, the patterns differ per region: in Central and Eastern Europe, Central Asia and South Asia, happiness goes down as age progresses. But in East Asia, but also in Western Europe, the best comes last: happiness levels go up as people enter their 70s.

The bad news: how unhappy are we?

  • There is still a lot, a lot of misery on our planet. More than fifty countries have happiness levels below 5.
  • And the worst-performing are truly miserable. Countries like Syria and Afghanistan, but also Rwanda, Benin and Burundi fall under 3.6 The lowest level is found in Togo at 2.839.
  • Two countries on different sides of the Mediterranean – Egypt and Greece – have lost more than one point. And some others (Jordan, Rwanda, Saudi Arabia, and Italy) lost around three quarters of a point.
  • For instance, the case of Italy (-.764, now at 5.948) is worrying. Usually, a high happiness level means a high level of resilience in phase of challenge. This fabric might be unraveled as result of the crisis Italy is going through.
  • To end with a positive note: he best ‘losers’, as far as one could be a loser with a score of 7.527, are the Danes. Denmark typically ranks one in most of the happiness report. I have been told that usually, it is no news when a happiness ranking is published, but this time it was: apparently, Danes are not used anymore to come second (or third, as now).

And now?

The 2015 World Happiness Report comes out with a large ambition: influencing the next development goals. As the UN prepares to adopt Sustainable Development Goals (SDGs) to succeed the Millennium Development Goals (MDGs) this year, the hope is that happiness outcomes are targeted within the SDGs. A worthwhile ambition: ultimately increasing human happiness and its fair distribution should be the goal of public policy.

One concern: the SDG process appears to be very complex, with over 150 different – and often, vague – ideas currently on the list of goals that could be adopted later this year. In such a process, they risk to lose their meaning. But either way, the wealth of statistics provides a lot of inspiration and background data to policy makers to make the world a happier place.

Geography of happiness