Until recently, I lived and worked in Belgium, and benefitted from a benevolent state taking care of me. I received lunch vouchers for around €100 to €150 a month. Plus ‘ecological vouchers’ for organic products or train travel. Plus ‘sports and culture’ vouchers, for, well, sports and culture. My monthly contribution to the public insurance fund came in at a very modest €8,00, and my own contribution for most treatments was fairly low. Had I lost my job, there would be an expansive social security system where I could get support. Sounds good, doesn’t it?
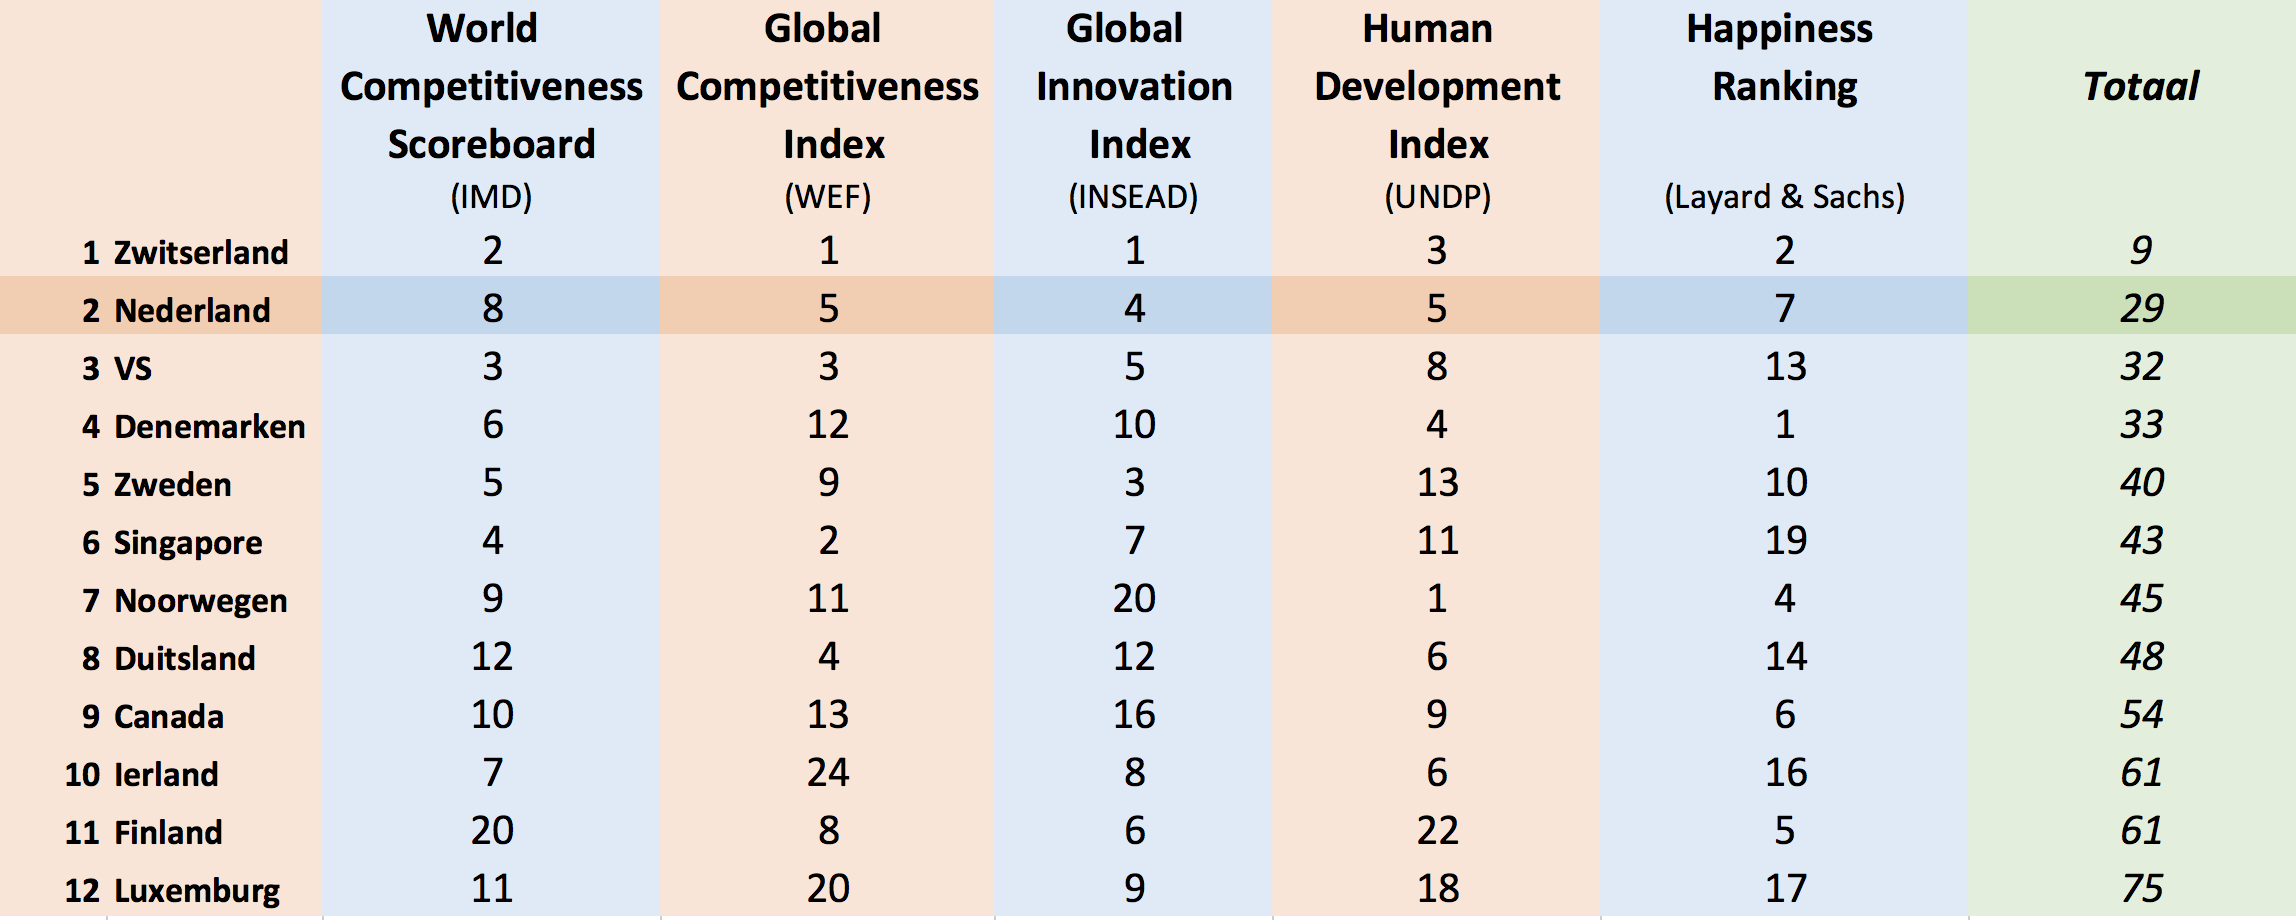
Well, I spent my time in one of the most heavily taxed countries of the world. Relatedly, Belgium ranks on top of the list across the OECD as for the labour costs – income tax, and employees and employers’ social security contributions. Over half of the wage costs of a Belgian employer account for income tax and social security contributions. Or in other words: it costs over €4,000 to have an employee with a take home pay of €2,000.
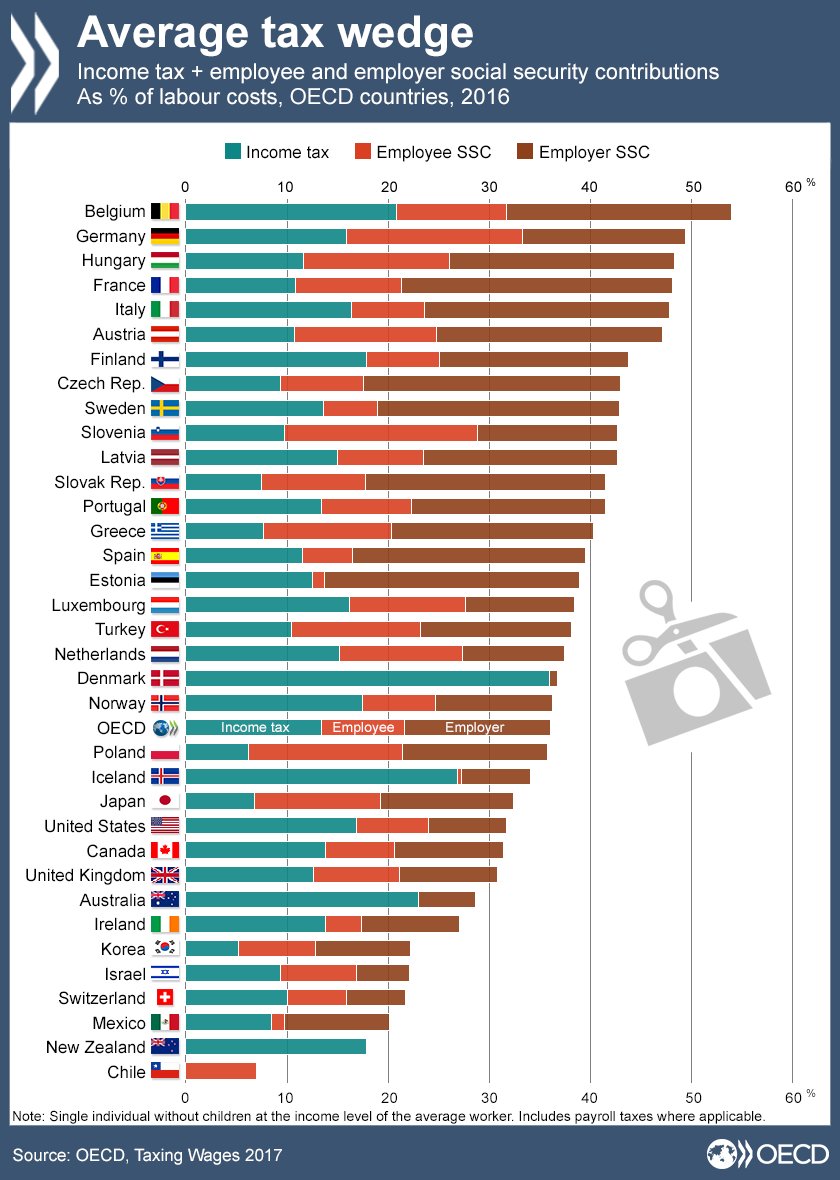
Tax wedges in OECD countries. Source: OECD
Basic income, revisited
Even if you agree with the noble goals, and despite the correlation between high taxes and happiness, wouldn’t it be a lot better to remove this money pumping function of the state? If a tax reform increased my net salary by the same amount, I’d have happily foregone all my vouchers and started paying an amount closer to the real cost of my insurance. Sweet and simple!
Last year I already wrote about the possibility of using basic income as a tool to simplify social spending. At the time – just after the Swiss voted ‘no’ in a referendum on the subject – I saw the possibility to get rid of series of tax breaks and charges that have little more effect than creating employment for tax collectors on the one side and tax consultants on the other.
Two things made me revisit the issue. Firstly, the policy discussion on basic income has advanced: more studies have been produced, and Finland’s experiment is underway. Secondly, we are getting a better picture on how basic income can help us solving social problems around globalisation and automation (the robots are coming, and they may give us the cash we need!). Let me take the second issue in a later piece, and look at the policy discussion now.
The Finnish experiment
Finland’s national experiment with basic income launched in January 2017, and contrary to other recent tests has nationwide coverage. 2000 selected Finns now get a monthly sum of €560 – no questions asked. That’s a modest amount, compared to the €2,500 national average wage. It’s not universal basic income per se, though. The participants are all unemployed; typical employees and billionaires don’t get basic income. Kela, the Finnish social security body that organises the experiments, deducts basic income from other social spending, so that basic income mostly replaces existing tools. Despite these limits in scope, the basic income is fully unconditional: participants are free to spend the money any way they like.
While Kela is clear that conclusions will only be reported after the end of the experiment, initial feedback confirms earlier anecdotal evidence that basic income increases the sense of freedom and happiness. Vice went to speak to Juha Järvinen, an artist who feels basic income allows him to focus on what he enjoys: creating the shaman drums that he sells. For Järvinen, the money is not the main advantage of the experiment: “you need to be a magician to survive” on €560 a month in Finland. Instead, it’s the fact that the employment office is not at his back all the time that gives him a sense of liberation. The basic income provides a first basis that makes it easier to undertake the project he likes. He recognises that with this level of spending a beneficiary couldn’t simply be lazy and do nothing, as some adversaries of basic income fear.
Left-wing and right-wing basic income
The Finnish government is a centre-right one, and this is visible in the design of the experiment. Typically, many proponents of basic income are centre-left, focusing on the benefits basic income offers to personal freedom and development, and quality of life. From a left-wing perspective, basic income is about citizens’ rights and distribution of state means. Basic income could then be a tool to ensure that citizens have equal possibilities, and that people of poorer or minority groups are not worse off.
The centre-right perspective would rather emphasise simplification and reduction of state spending. Basic income could replace up to 100 tax incentives in the Finnish case. This is also a key condition to ensure that basic income remains affordable, they argue.
Can we pay it?
That begs the critical question: can we afford basic income? The low Finnish basic income is set up with affordability in mind. It’s not an easy question. The answer of the advocacy group, the Basic Income Earth Network (BIEN), boils down to ‘it depends‘: if we narrowly redistribute existing benefits, it could work. However, if we maintain all existing benefits and then add a broader basic income for everybody to live comfortable, governments will struggle to find the means.
Is basic income better than current social spending?
The Organisation for Economic Cooperation and Development (OECD) weighed into the debate via a study outlining a slightly different question: does basic income reduce poverty and increase equality? The study started with the observation that social expenditure is targeted in wildly different ways. As of 2013, the 20% richest in the average OECD country benefitted only marginally less from cash transfers than the 20% poorest. In most countries, the poor obviously benefitted more from transfers than the rich. But in a few countries, particular subsidies worked out in a net transfer from everybody else to the rich, including Greece, Italy, Poland, and Portugal.
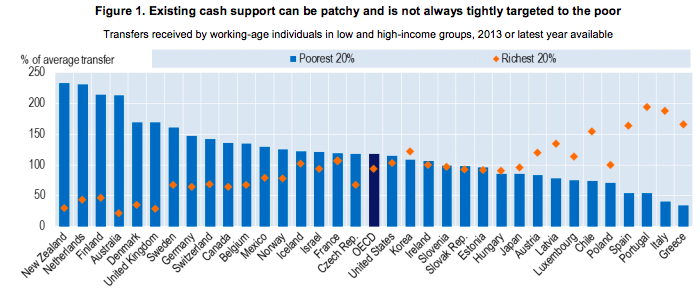
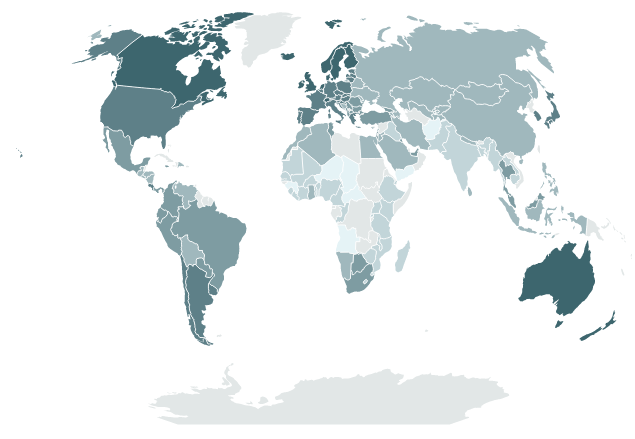
Beneficiaries of cash transfers in OECD countries, 2013. Source: OECD
So, does basic income do a better job? According to the OECD, it probably doesn’t. If basic income were to be set at the level of current spending – a narrow basic income – it would remain below the poverty line across all OECD countries, sometimes staying far below. Not surprisingly, if you consider that at present only a share of the population benefits from public spending. As such, basic income would risk distributing from the poor to all. Then, it could draw similar criticism as some education grants do: funds paid for by the baker and the electrician to finance the career investment of the lawyer’s son.
Redistribution from the poor to all
Looking at modeling of how basic income could work in Finland, France, Italy, and the UK, the study finds that a narrow basic income indeed would not reduce poverty. Rather than sharing wealth, the changes in public expenditure would redistribute poverty along different lower-income groups. As such, simply pooling existing benefits and reallocating them as basic income is not the right solution. But there might be other ways – maybe robots could come to rescue? That, however, is a topic for another post. See you later!